Ice grew at 5,100 square kilometers (2,000 square miles) per day faster than the average rate of ice growth for the month during October
Rapid expansion of the Arctic sea ice cover is the norm for October as solar input dwindles and the remaining heat in the upper ocean is released upwards, warming the lower atmosphere and escaping to space. Because of late season growth, the seasonal Antarctic maximum we previously reported as occurring on September 15 was exceeded, with a new maximum set on October 11 and 12. This is the second-lowest and second-latest seasonal maximum extent in the satellite record.
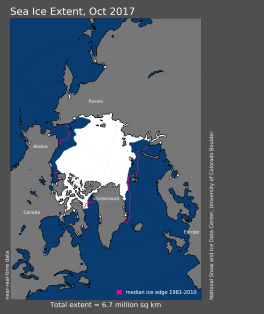
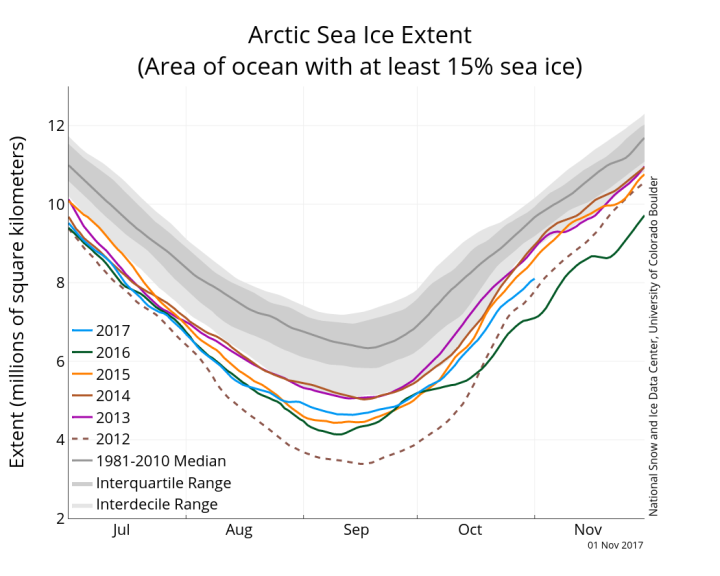
Arctic sea ice extent for October 2017 averaged 6.71 million square kilometers (2.60 million square miles), the fifth lowest in the 1979 to 2017 satellite record. This was 1.64 million square kilometers (633,000 square miles) below the 1981 to 2010 average and 820,000 square kilometers (317,000 square miles) above the record low October extent recorded in 2012. By the end of October, extent remained below average throughout most of the Arctic except within the Laptev Sea, which is fully ice covered. Ice growth over the month was most prominent within the Beaufort, East Siberian, and Laptev Seas and within Baffin Bay. In the Chukchi, Kara, and Barents Seas, the rate of ice growth was slower. Ice extent also remains far below average in the East Greenland Sea.

Ice growth during October 2017 averaged 94,200 square kilometers (36,000 square miles) per day. This was 5,100 square kilometers (2,000 square miles) per day faster than the average rate of ice growth for the month. Total ice extent for the month remains more than 2 standard deviations below the 1981 to 2010 average.

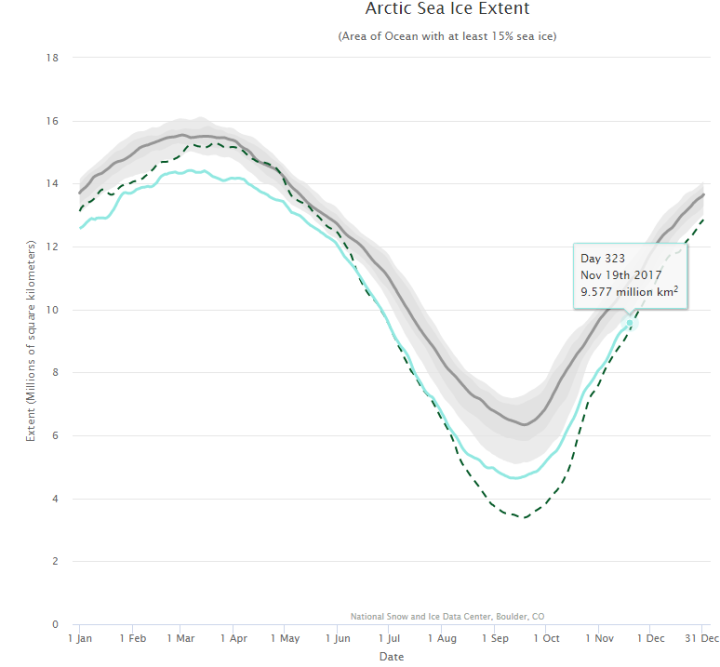
Here is the current sea-ice graph from NSIDC:
Source: https://nsidc.org/arcticseaicenews/charctic-interactive-sea-ice-graph/
More at NSIDC sea Ice News
Comment: With Arctic and Antarctic ice records being broken year on year it seems the predictions of an impending ice-age are looking more likely and the idea of global warming was a lie:
- Astrophysicist: "Mini Ice Age is here to stay"
- Volcanic eruptions to cool Earth, record Arctic sea ice growth occurring
- Arctic sea ice increases in August & Europe begins 1963 cooling repeat
- Oops! Scientists who claimed Arctic ice would melt entirely by September 2016 got it badly wrong
- Data shows massive Arctic Ice gain over past five years
- The Solar Minimum, Earthquakes and Mini Ice Age - and What to Expect: Interview with John Casey, Author of UPHEAVAL and Dark Winter (VIDEO)
- Ice Ages start and end so suddenly, "it's like a button was pressed," say scientists


Reader Comments
to our Newsletter