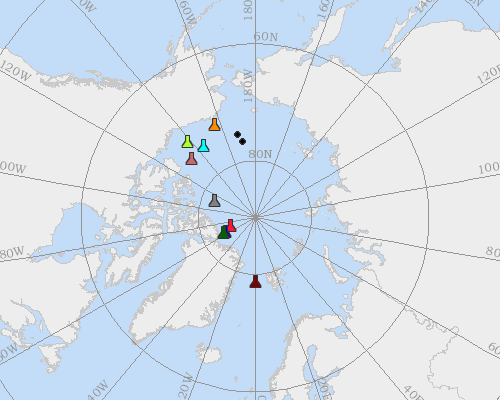
The WUWT Arctic Ice Thickness Survey has been conducted from the comfort of a warm living room over the last half hour, without sponsors, excessive CO2 emissions or hypothermia. The data is collected from the US military web site. All of the active military buoys show significant thickening ice over the past six months to a year, as at right.
Buoy 2008B has thickened by more than half a metre since last autumn, and is more than 3 metres thick.
2008C also shows thickening by more than half a metre since last autumn, and is nearly 4 metres thick.
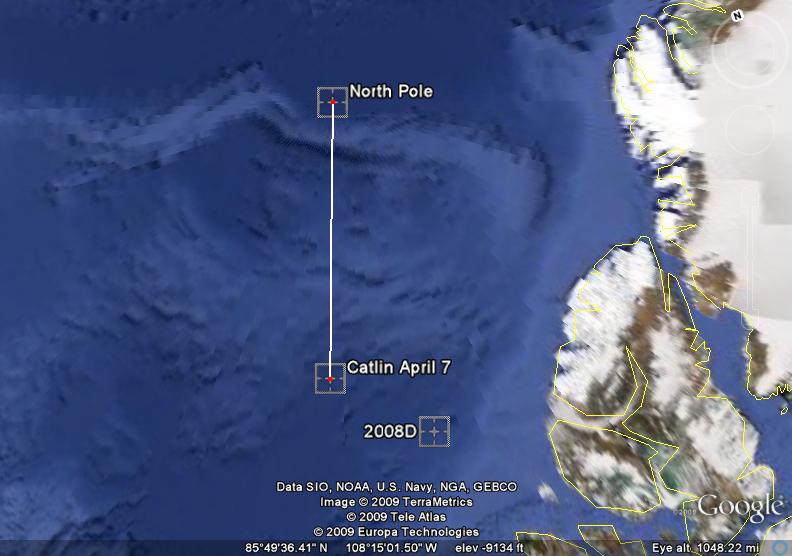
2008D has not been updated since early February, but showed thickening and is 3.5 metres thick. It is close to the Catlin team position.
2007J has thickened more than half a metre, and is nearly 4 metres thick.
2006C has thickened by nearly a full metre over the past year, and is more than 3 metres thick.
UPDATE: The military site also has graphs which are supposed to show depth. It appears that many of these are broken, which is why I used the more reliable temperature graphs. The depth at which the ice drops below the freezing point of seawater (-2C) is of course the bottom of the ice. You can't have water in a liquid state below it's freezing point.
Some of the buoys have reliable depth data, and they correspond closely to the temperature data - for example 2007J which shows 400cm for both.
(Link) (Link)


Reader Comments
to our Newsletter