The time of the demise of the mammoths is also known as the Younger Dryas, a period of global cooling that lasted from 12,900 to 11,700 years ago (10,900 B.C. to 9,700 B.C.) during which surface temperatures dropped by approximately 7°C.
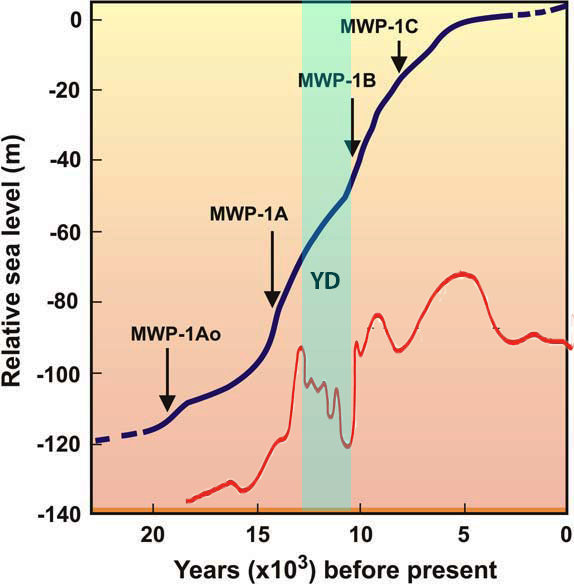
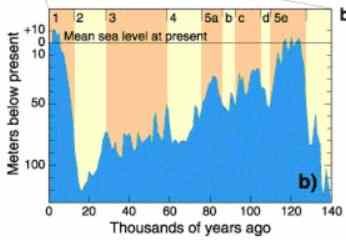
In theory, such a severe cooling should increase the volume of polar ice and, as a result, reduce sea level. However, during the Younger Dryas, sea levels rose 17 meters over more than a millennium, as illustrated by the graph below.
If the sea level rose while ice caps were building up, it's possible that the source of the water was external. But where could this water have come from?
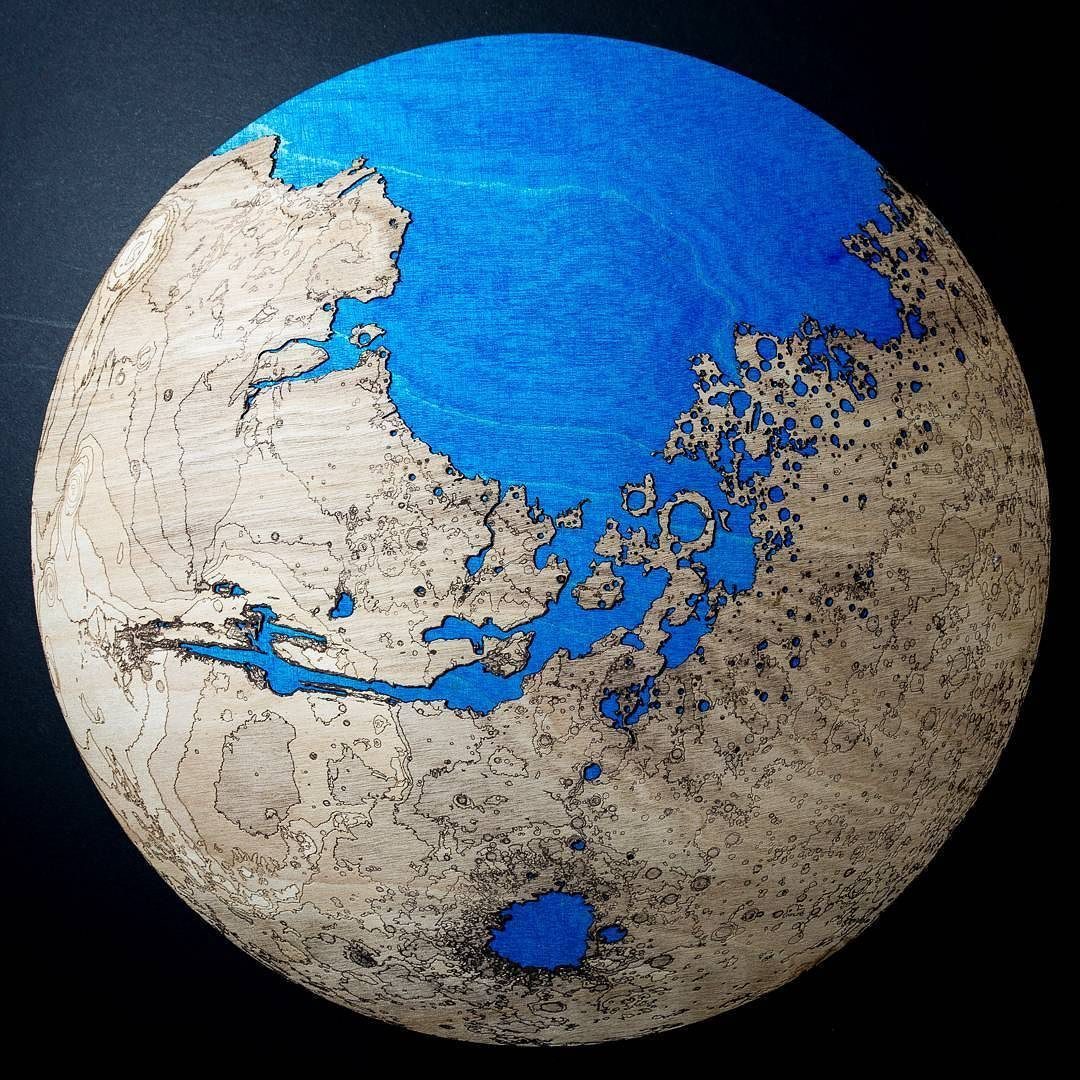
Coincidentally or not, most of Mars' Northern hemisphere was once covered with water, and this ocean has mysteriously disappeared. So where did the Martian water go?
Sea Levels on Earth
The Younger Dryas was triggered by major meteorite impacts (c. 12,900 BP) on the Laurentide ice sheet, as described in the Frozen Mammoth article. These impacts very likely melted massive quantities of ice and led to a sea level rise. However the 1,200 years of cold temperatures that followed should have frozen at least some water and reduced sea levels, yet sea levels rose dramatically throughout those 1,200 years.
In any case, the meteorite impacts on the Laurentide ice sheet can only explain a small part of the 17 meter rise observed during the Younger Dryas.
Reconstruction of the glacial melt history finds major northward melt-water discharge 13,100-12,500 years ago, at the beginning of the Younger Dryas. The outflow entered the Arctic Ocean, via the Mackenzie River, Fram Strait, and ultimately reached the eastern North Atlantic.According to Leverman et al., a 7°C drop in temperature should lead to a sea level drop of about 28 meters (~4 m/°C). As shown in the diagram above however, the sea level rose about 17 meters during the Younger Dryas, while the melting of the Laurentide ice sheet should have increased sea level by 6 meters.
Geomorphological data, on the other hand, suggest that ice still blocked routes to the north and east toward the St. Lawrence Seaway until the end of the Younger Dryas. Sea level curves from Tahiti, New Guinea, and Barbados show a small step (under 6 meters) around 13,000 years ago near the Younger Dryas onset, which may have come from this deluge.
~ Vivien Gornitz, Rising Seas: Past, Present, Future, p.127
It means that about 39 meters of extra water (17+28-6) was added on the surface of the Earth. Keep in mind that those three figures are just approximations, estimates based on a number of hypotheses. They provide us nonetheless with an order of magnitude.
Water on Mars?
In 1666, famous astronomer Cassini, through simple telescope observations, observed ice-like polar caps and clouds on Mars and concluded that there was obviously water on Mars.
Cassini's view prevailed for a few centuries, but modern science rejected Cassini's claim and the new doctrine became that there was no water whatsoever on Mars. It's only recently, with the massive flow of data coming from Martian probes and rovers, that the evidence became overwhelming that Mars did indeed have water at some point in the past.
According to a paper published in Science in 2015, Mars used to hold enough water to cover its entire surface in a liquid layer about 140 meters deep. About 85% of this water has, however, "disappeared" (the remaining 15% is stored under ice at the poles).
Apparently, Martian water was not uniformly spread over the surface of the planet. According to a recent topographic study, most of the Martian water was stored on the North of the planet, in one single ocean, with a similar volume to Earth's Arctic ocean.
If this water was somehow transferred to Earth, it would result in an approximate sea level rise of 34 meters. This figure is comparable, in terms of magnitude, to the 39 meters estimate mentioned above.
How Could Mars Lose its Water?
As noted, most water on Mars has "disappeared". Modern science offers two explanations for this: underground leakage and space leakage.
Underground leakage is highly unlikely because Mars has no known tectonic plates and therefore no subduction, which is the main phenomenon through which surface water is brought underground.
Space leakage posits that, about 4.2 billion years ago, Mars lost its magnetic field and, devoid of this protection, solar winds stripped the planet of its atmosphere, and most of its water, within a few hundred million years.
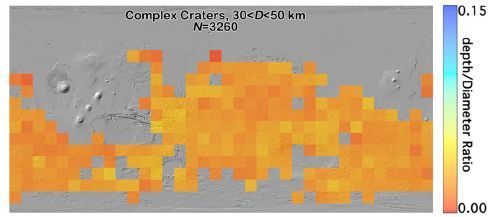
However, this is probably not true for one simple reason: the top half of the Martian Northern hemisphere (where the Martian ocean once stood) exhibits far less and far smaller craters than the rest of the planet.
In 2011, Robbins et al published a database listing close to 400,000 craters. The picture on the right is excerpted from this paper and shows the geographic distribution of Martian craters (diameters between 30 and 50 km). Obviously, most of Mars' Northern hemisphere exhibits a far lower concentration of craters than the rest of the planet.
If Mars' ocean disappeared about 4 billion years ago, how can we explain that Mars' ocean bed is almost devoid of asteroid impact evidence while the rest of the planet is covered with craters?
One potential explanation would be that most impacts on Mars happened more than 4 billion years ago, when the ocean was still there and acted as a damper, preventing the formation of craters on Mars' surface.
However, this explanation doesn't seem to hold up. Despite an almost non-existent atmosphere, violent dust storms occur on Mars that erode craters. Given that Robbins et al identified "well-preserved" craters on Mars, these craters must be relatively recent.
The geographic distribution of this type of crater reveals the same pattern: there are less recent craters where the Martian ocean was in comparison to the rest of the planet.
The above strongly suggests that Mars lost its water much more recently than mainstream science claims.
Interplanetary Electric Discharge
The Electric Universe theory, as described in our book Earth Changes and the Human Cosmic Connection, shows how celestial bodies (planets, stars, moons, comets, etc) are electrically charged. In addition, such bodies are surrounded by a sort of "insulation bubble" (Double Layer).
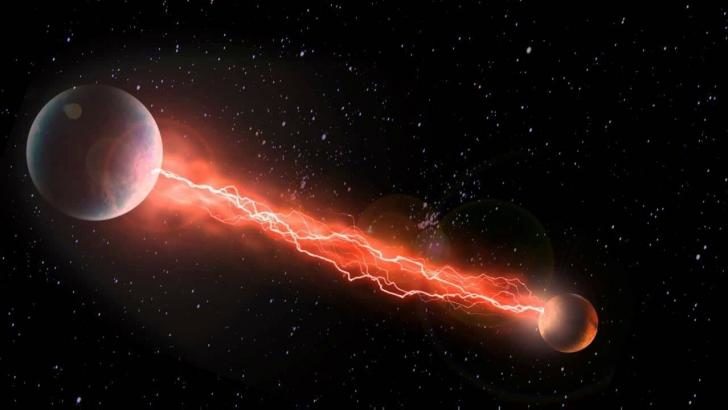
When two astronomical bodies, like two planets, get close enough, an electric discharge forms from the most negative planet to the most positive one, in order to re-balance the electric charge of the two planets. Electric discharges between celestial bodies have been observed several times. Here are a few examples:
- Between Fragment G of Comet Shoemaker-Levy and Jupiter:
The Hubble Space Telescope detected a flare-up of fragment "G" of Shoemaker-Levy long before impact at a distance of 2.3 million miles from Jupiter. For the electrical theorists this flash would occur as the fragment crossed Jupiter's plasma sheath, or magnetosphere boundary.- Between Io, one of Jupiter's moons, and Jupiter:
Thunderbolts, Deep Impact and Shoemaker-Levy 9
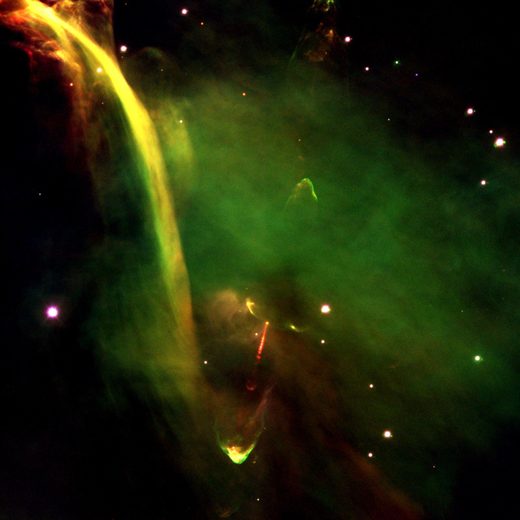
In November 1979, the noted astrophysicist Thomas Gold proposed that the gigantic plumes on Io are not volcanic but evidence of electrical discharging.Years later, a paper by Peratt and Alex Dessler followed up Gold's suggestion, showing that the discharges took the form of a 'plasma gun effect,' which produces a parabolic plume profile, filamentation of the matter within the plume, and the termination of the plume onto a thin annular ring.- Herbig Haro Object 34. Here, electric discharges, in the form of interstellar Birkeland currents, occur between proto stars and proto planets:
W. Thornhill, The Electric Universe, p.112
Electric discharges between celestial bodies are very similar to arc welding. When the negatively charged electrode is brought close enough to the positively charged part, an electric arc, ionized air (plasma), appears and electrons travel in the plasma (along what is called "Birkeland currents") from the electrode (stick) to the welded part in order to re-balance the electric charges.
Notice that during arc welding, electrons are not the only material transferred from the electrode to the welded part; (negatively charged) molten metal from the tip of the electrode is carried towards the positively charged welded part.
Another typical feature of such electric discharges is "electric scarring". These fractal patterns are known as 'Lichtenberg figures'. Lichtenberg is the physicist that discovered this phenomenon in 1777. Notice that the polarity of the scarred material has marked influence on the form of the Lichtenberg figure:
[...] there is also a marked difference in the form of the figure, according to the polarity of the electrical charge that was applied to the plate. If the charge areas were positive, a widely extending patch is seen on the plate, consisting of a dense nucleus, from which branches radiate in all directions.
Negatively charged areas are considerably smaller and have a sharp circular or fan-like boundary entirely devoid of branches. Heinrich Rudolf Hertz employed Lichtenberg dust figures in his seminal work proving Maxwell's electromagnetic wave theories
Relative Polarity of Mars and Earth
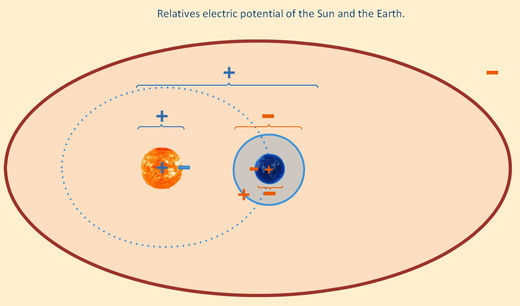
As described in chapter 8 of Earth Changes and the Human Cosmic Connection, in our solar system, the Sun is the most positive body. Therefore, the further away from the Sun a planet is, the more negative its electric potential is. Being further away from the Sun than Earth, Mars' electric potential is lower than that of Earth's.
As a consequence, if an electric discharge happened between Mars and Earth, it started from the most negatively charged body (Mars) and spread towards the most positively charged body (Earth).
Mars was the cathode (negatively charged) and was stripped of material (gases, rocks, water), and the electric scarring should exhibit craters, striking at a high point, forming craters and steep-sided trenches.
If the surface is a cathode (negatively charged), the arc will tend to move across the surface. After striking, usually at a high point, and eroding a crater, the arc may jump to a new high point — the rim of the new crater is a most likely target.
The abundance of small craters centered on the rims of larger ones testifies to this predictable behavior. As the arc travels, it may erode a series of craters in a line, appearing as a chain of craters.
If the craters in these chains overlap, the effect is a steep-sided trench with scalloped edges. The arc may erode a trench for a distance and then jump some distance away before eroding another trench. These "dashed line" trenches will usually have circular ends and constant widths. All of these patterns occur in great abundance on the surface of Mars.
W.Thornhill, The Electric Universe: Part II Discharges and Scars
Signs of electric discharge on Mars
If a massive electric discharge occurred between Mars and Earth, is there any trace of a major (negative) Lichtenberg figure, as described above, to be found on Mars?
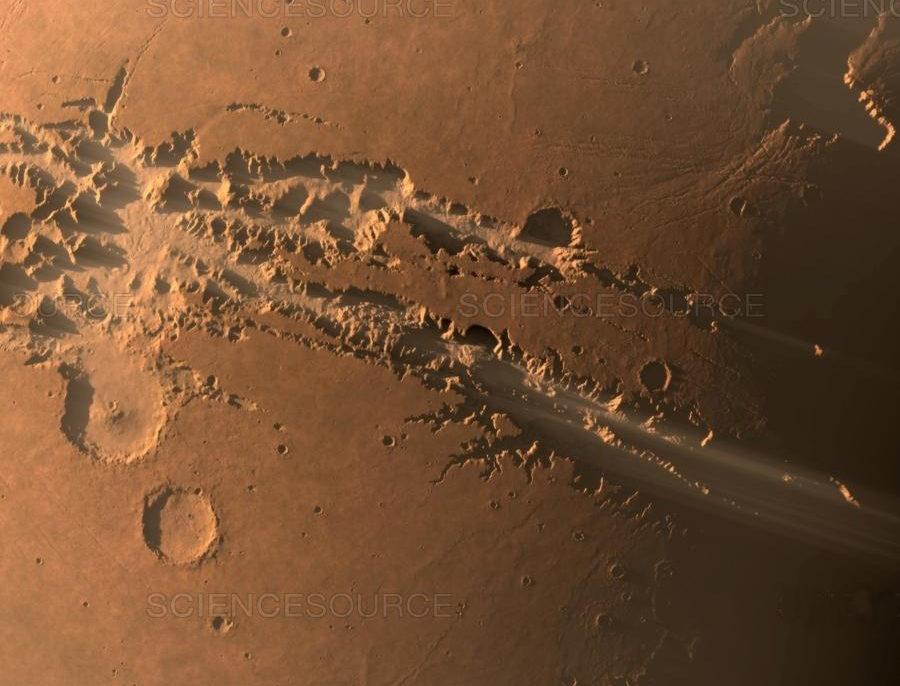
One of the main geological features of Mars is Valles Marineris. At more than 4,000 km (2,500 mi) long, 200 km (120 mi) wide and up to 7 km (4.5 mi) deep, it is the second largest canyon in the entire Solar system, and stretches for nearly a quarter of the planet's circumference.
Mainstream science theorizes that Valles Marineris formed as a result of water erosion billions of years ago. However, this explanation doesn't seem to match some of the characteristics of Valles Marineris:
- In Valles Marineris, the "outflow" is as narrow as the "inflow", and the middle of the course constitutes its broadest part. Overall the width is quite constant, unlike rivers, which tend to broaden over their course.
- The "course" of Valles Marineris doesn't follow the downslope. It sometimes "runs" uphill although there is no sign of the damage - rifts for example - that might be expected if the topographical changes were due to later vertical movement of the terrain.
- Valles Marineris doesn't reveal signs of tributary "rivers". The two major "rivers" that can be imagined run parallel to each other. The secondary "river" joins the main one at a near right angle, unlike the converging path usually exhibited by tributaries that join a main river.
- The floor of Valles Marineris reveals transverse markings, unlike river beds that tend to have longitudinal markings shaped by the river flow.
- The "tributaries" exhibit a V-shaped cross-section while water erosion typically forms U-shaped river beds.
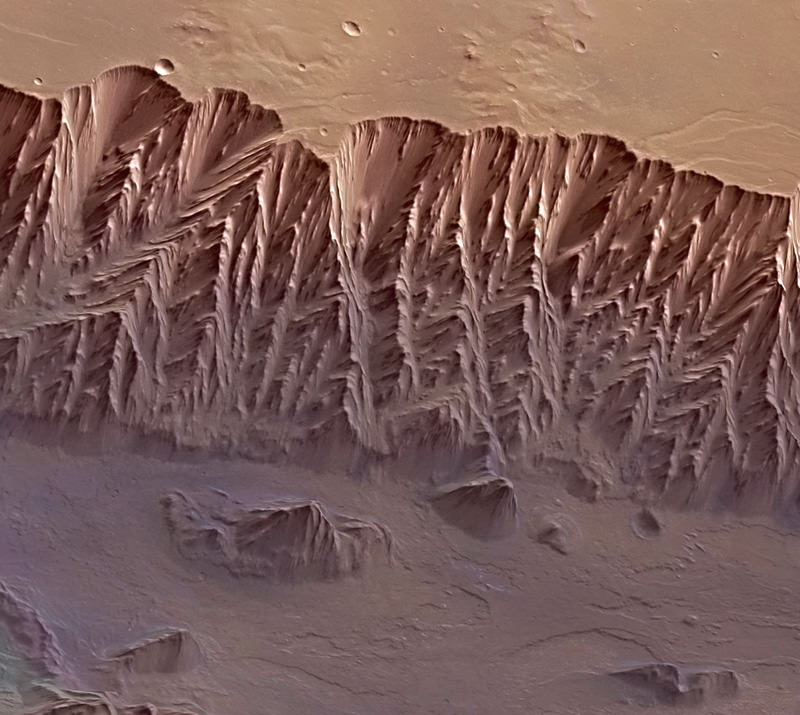
- Valles Marineris banks are very deep (7 km) and very steep. The banks show no sign of water erosion and its typical horizontal marking. On the contrary, the markings reveal a vertical chevron pattern.
When planets come close, gargantuan interplanetary lightning results. It is perfectly capable of stripping rock and gases from a planet against the puny force of gravity. It does so leaving characteristic scars. [...]Interestingly, Valles Marineris is contiguous to the ocean that once covered most of Mars' ocean. If Valles Marineris was the location of an electric discharge between Mars and Earth, the adjacent Martian ocean would have certainly been affected, and possibly transferred.
The parallelism of the canyons is due to the long-range magnetic attraction of current filaments and their short-range strong electrostatic repulsion.
Particularly significant are the small parallel rilles composed essentially of chains of craters. A traveling underground explosion follows the lightning streamer and cleanly forms the V-shaped tributary canyons.
There is no collapse debris associated with undercutting water flow. Similarly, the "V" cross-section is usual for craters formed by underground nuclear explosions. The circular ends of the tributaries, where the explosion began, are precisely of that shape.
In comparison, headward erosion by ground water sapping gives a U-shaped cross-section and does not necessarily end in a circular alcove.
Note that some of the tributary canyons on the south rim of Valles Marineris cut across one another at near right angles. This might be due to repeated discharges from the same area chasing the main stroke as it travelled along Ius Chasma. No form of water erosion can produce crosscutting channels like that.
The fluted appearance of the main canyon walls is probably due to the same travelling explosive action.
W. Thornhill, Mars and the Grand Canyon
Evidence of Material Transfer From Mars to Earth
As mentioned in the above quote, a massive electric discharge from Mars to Earth could have stripped significant quantities of rocks from Valles Marineris. So, before looking for signs of a major (positive) electric discharge on Earth, let's see if there is any evidence of Martian rocks on Earth.
As of 2019, 237 Martian meteorites have been found on Earth, according to the Meteoritical Society. So, transfer of material from Mars has occurred.
One might assume that this phenomenon is very ancient and occurred billions of years ago when the planets were forming, and when asteroids were rampant and orbits were unstable. But data suggests that this is not exactly the case.
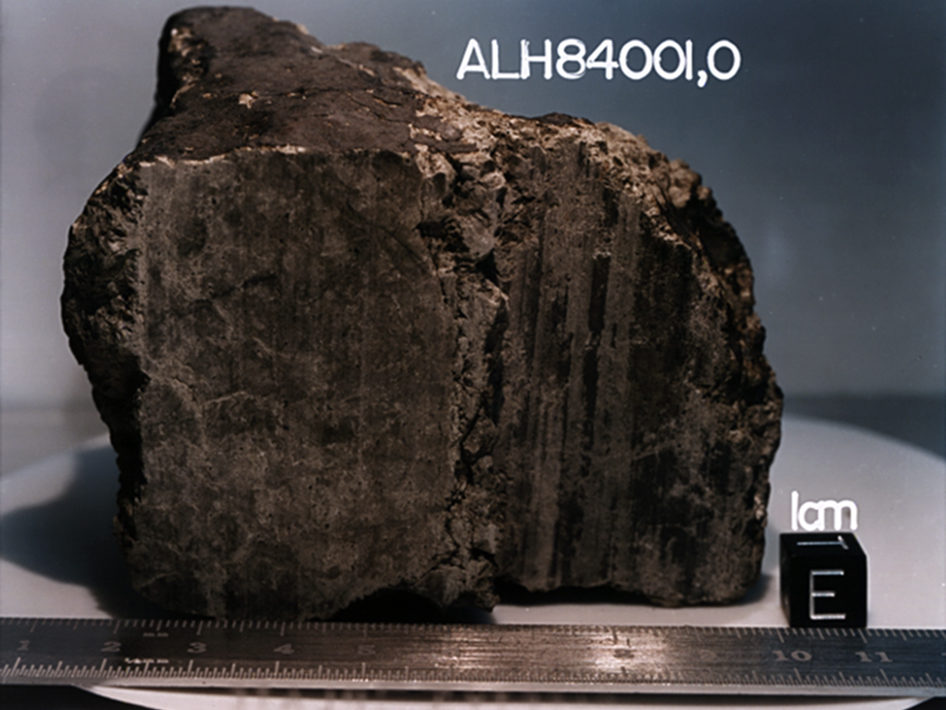
While the landing time for most of Martian meteorites is unknown, a few have been dated - in particular the Martian meteorite commonly abbreviated ALH84001, which was found in 1984. Its ETA on Earth has been estimated at 13,000 years ago (11,000 B.C.).
According to Hamilton et al, the origin of ALH84001 is Valles Marineris because of its geological nature (orthopyroxenite), which is the only place where orthopyroxenite has been found (via spectral analysis). In fact, ALH84001 is the only orthopyroxenite Martian meteorite. No other meteorite of this kind has been found on Earth.Interestingly, because of its carbonates content, ALH84001 is the only meteorite originating from a time period during which Mars is suspected to have supported liquid water. ALH84001 is an abbreviation which stands for ALlan Hills 84001. Allan Hills is located along the southern coast of Antarctica.
Now, let's recapitulate some key characteristics of ALH84001:
- It comes from Valles Marineris
- At the time of its arrival on earth, Mars was a wet planet
- It landed on Earth 13,000 years ago
- It was found in Antarctica
Indeed, there is a rare type of Martian meteorite called "nakhlite". Only 21 specimens have been found on Earth so far. Nakhlites are rich in augite (a silicium-based mineral) and they formed from basaltic magma about 1.3 billion years ago.
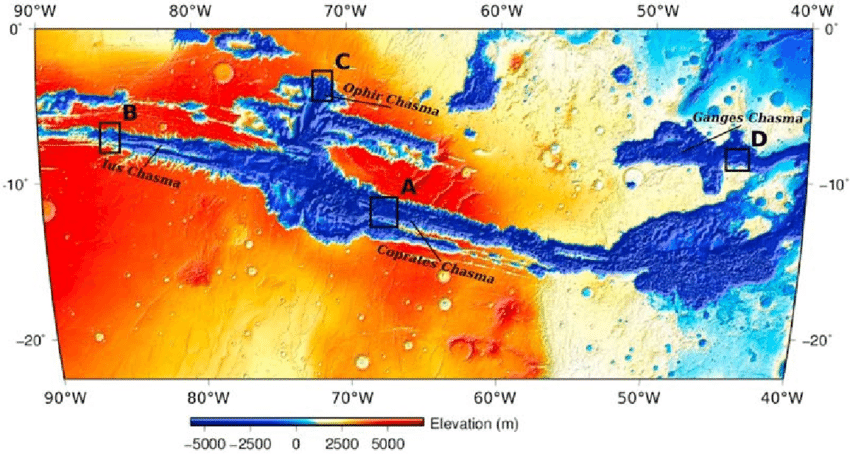
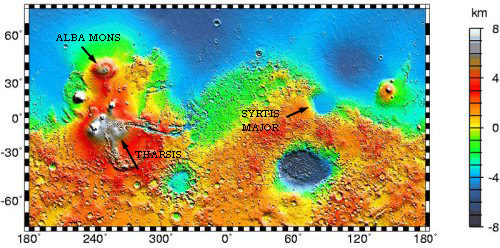
Because of the composition and age of the nakhlites, they are believed to originate from one of these three Martian volcanic areas: Tharsis, Elysium, or Syrtis Major Planum.
Interestingly, as shown in the above map, each of those three volcanic constructs is situated near the coast of what was once the Martian ocean.
Of the 21 nakhlite meteorites that reached Earth, 7 of them were found in Antarctica - that is 33%. This is a high percentage knowing that only about 12% of all meteorites that reached Earth were found in Antarctica. Mass wise, 16.9 kg of nakhlite meteorites were found in Antarctica - that is 54% of the total mass of nakhlite meteorites.
Lastly, the nakhlite meteorites are believed to have fallen to Earth up to 10,000 years ago. This figure is quite close to the arrival date of ALH84001 (13,000 years ago).
Any Sign of Electric Discharge on Earth?
If a massive electric discharge initiated from Valles Marineris and hit Earth, where did the hit occur?
There are several canyons on Earth, including the Grand Canyon, which hold features of electric scarring. However, the data about Martian meteors provided above reveals a strong affinity of Martian meteorites for Antarctica.
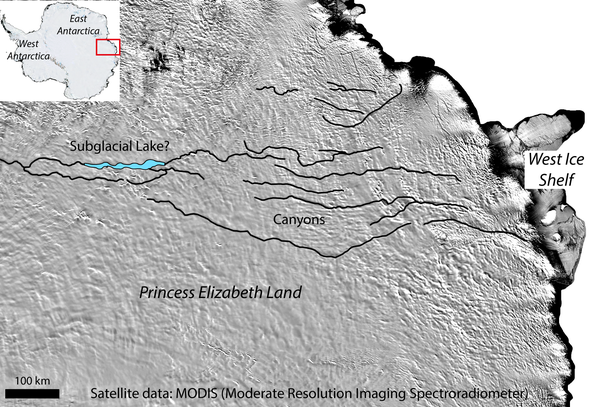
Does the bedrock of Antarctica show any sign of positive electric scarring, i.e. a massive canyon-like geological feature? Indeed it does. As shown in the satellite picture above, Antarctica is considered to host the largest canyon on Earth, according to a 2016 geological survey:
[...] the largest unsurveyed region on the icy continent is a region called Princess Elizabeth Land. Now a team of geologists has scoured that area to reveal a massive subglacial lake and a series of canyons, one of which — more than twice as long as the Grand Canyon — could rank as Earth's largest.At this point, Martian meteorites and traces of electric scarring point to Antarctica for a potential location for the Mars-Earth transfer. But what about the main constituent of the whole process; water?
If Mars lost most of its water to Earth, there should be some evidence of this massive transfer, on our planet in general and in Antarctica in particular.
Could part of the Antarctica ice sheet be of Martian origin? To answer this question, let's first observe the Antarctic ice sheet and then compare it to its Arctic counterpart.
The Antarctica ice sheet is massive. It contains about 30 million km3 (7.2 million cubic miles) of ice. This represents more than 70% of Earth's freshwater. In comparison, the arctic ice sheet, located over Greenland, is only 2.9 million km3 (0.68 million cubic miles).
In terms of volume, the Northern ice sheet is less than 10% of Antarctica's ice sheet. Notice also that Antarctica does not form one single solid continent. It's more like an archipelago constituting of a few massive islands separated by deep marine areas, as depicted in the map above.
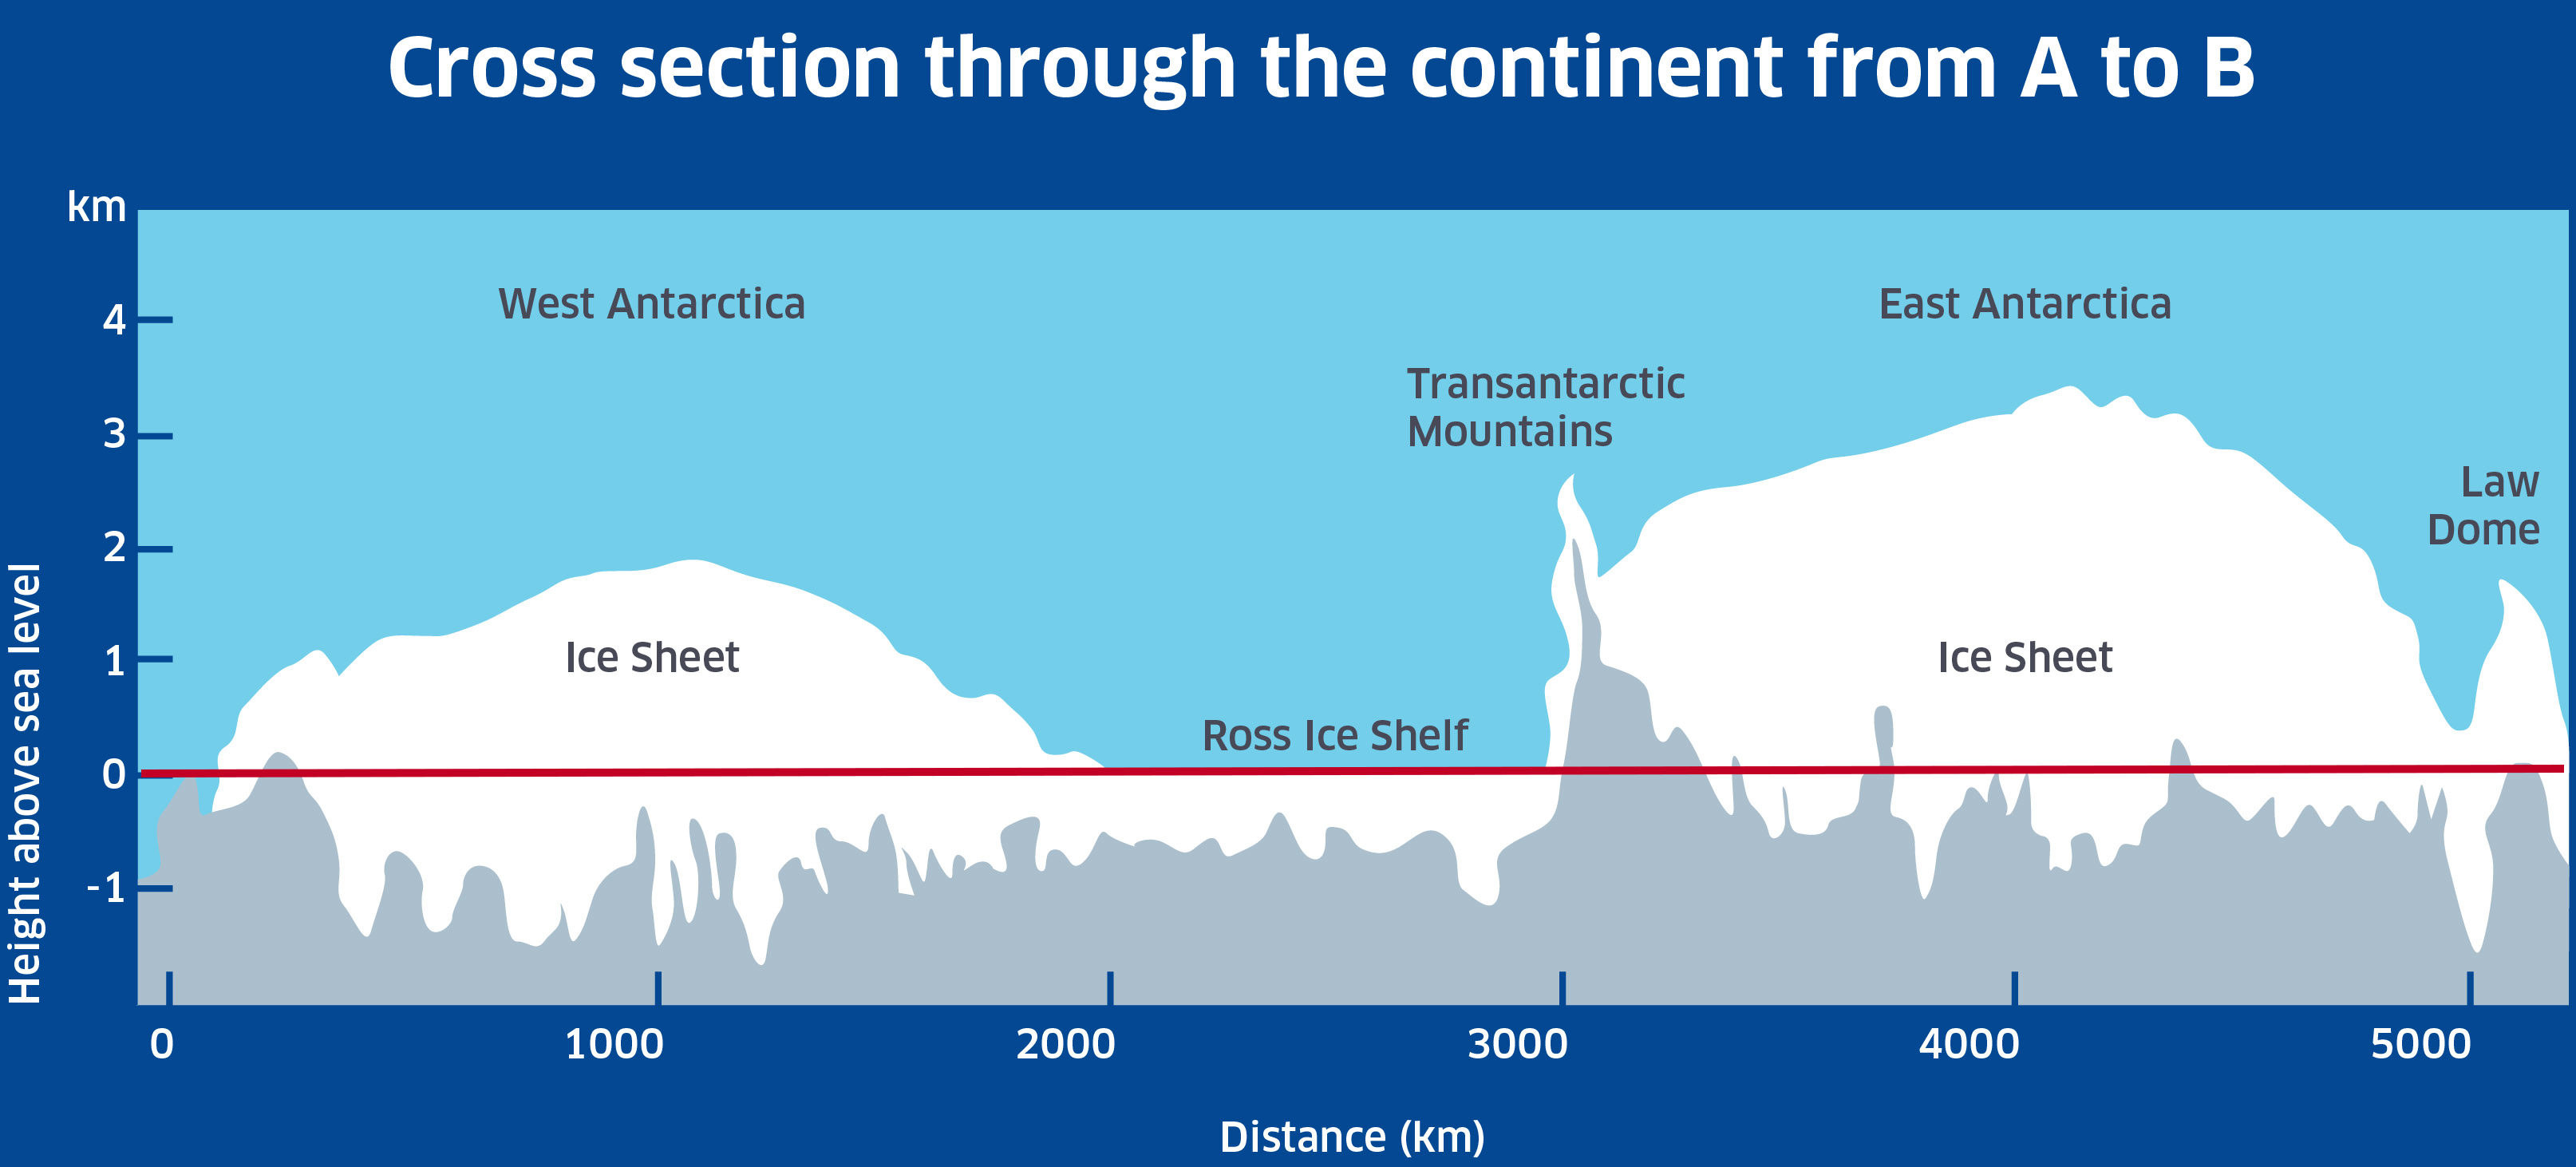
Between the islands covered by the Antarctic ice sheet, the bedrock can be as low as 2,500 meters below sea level. This means that in some places the ice sheet is more than 4 km (2.7mi) thick - 1.5 km (1mi) above sea level and 2.5 km (1.7mi) below sea level (see cross section of Antarctica below).
For comparison, the Arctic sea ice reaches a maximum thickness of 4 meters with ridges up to 20 meters, although the average depth of the Arctic Ocean is 1,038 meters, which is comparable to the depth of the Antarctic "ocean".
The question then arises: why is there so much more ice in Antarctica compared to the Arctic? Why does Antarctica ice extend 2,500 meters below sea level and reach the bedrock, while Arctic ice is a mere 4 meter thick layer floating on the ocean?
According to mainstream science the Antarctic and Greenland ice sheet were formed because of the incremental accumulation of snow, year after year. This suggests that Antarctica experienced a lot more snowfall. But data shows the opposite. Indeed, Antarctica is one of the driest places on Earth, with only 18 cm/year of precipitation, while the Arctic region experiences almost double this figure with 32 cm/year.
If Antarctica receives less snow than the Arctic region, the only explanation for its tenfold higher quantity of ice is that it experiences less melting. Maybe Antarctica is experiencing much colder temperatures relative to the Arctic region? Again data suggests the opposite.
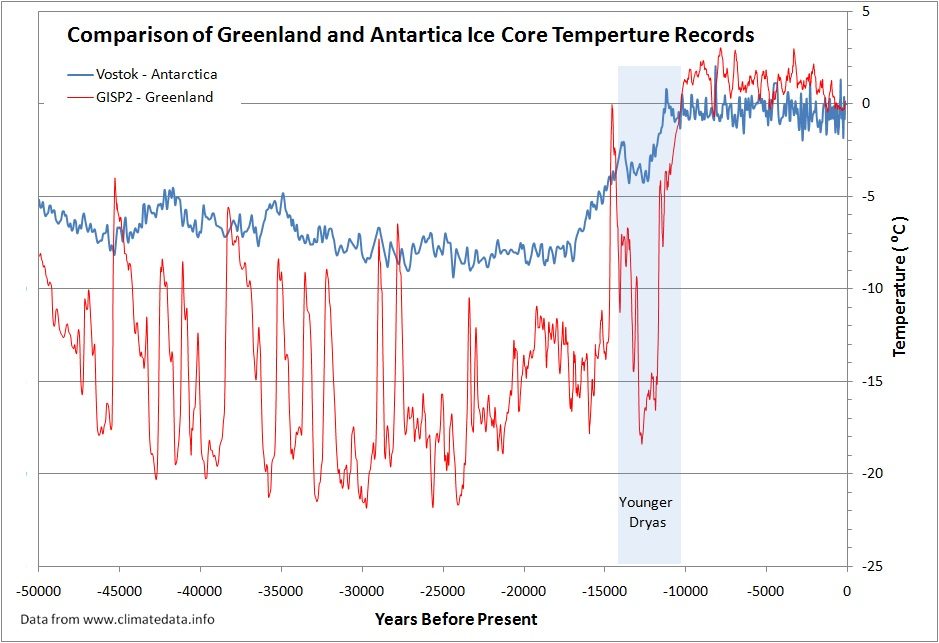
As shown in the graph below, for eons the Arctic region has been much colder than Antarctica. For the last 11,000 years, the Antarctic has been marginally colder than the Arctic.
Also, notice in this same graph the close correlation between Greenland (GISP2) and Vostok (Antarctica) ice core-based temperature reconstruction from today back to the Younger Dryas. What we see is that, around 11,000 years BP, a sudden and marked de-correlation occurred. Between 11,000 BP and now, the two temperature curves are very similar in shape and very close in terms of value. Before this time (50kY BP to 11 kY BP) the two curves are totally divergent.
Are these two curves telling us about the environmental conditions of two different planets?
In any case, no endogenous cause (snowfall difference, temperature difference) can explain the marked difference in depth and volume between the Antarctic ice sheet and the Arctic one. A massive and sudden inflow of exogenous water (in ice form) in Antarctica would, however, explain these discrepancies.
How Could Mars Get so Close to Earth?
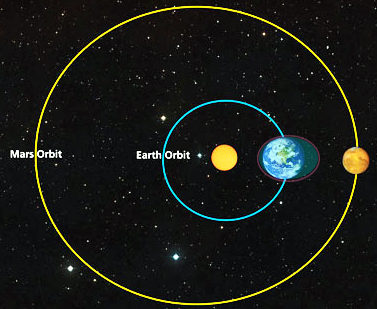
Mars exhibits the second largest eccentricity of all planets in the solar system. Large eccentricities usually suggest orbits that were disrupted in the recent past. Because of this marked eccentricity, Mars can get as close as 56 million kms from Earth, as shown in the diagram below.
For comparison, Earth's magnetotail extends more than 6 million km (blue and purple ellipse in the image above).
So, electrically speaking, Mars is only one order of magnitude away from of Earth. However, the normal distance between Earth and Mars is too large for any electric discharge between the two planets. But could some kind of cosmic disruption have brought the two planets abnormally close?
The obvious agent for such a massive orbital disruption would be a comet, but one large enough to move Mars, which is ten times heavier than the Moon, away from its initial orbit.
This scenario is actually the main theory developed by Emanuel Velikovsky in his best-selling book, Worlds in Collision, published in 1950.
Using mostly comparative mythology, Velikovsky proposed that Venus was initially a comet that disrupted the orbit of Mars, then subsequently made a close approach to Earth.
Scientific leaders ruthlessly lambasted Velikovsky's catastrophist theory because it directly threatened their fundamental paradigm, uniformitarianism, without which the church of materialist progress and its Darwinian atheist creed would inevitably collapse. Adding insult to injury, Velikovsky based his work on religious texts and showed that they might carry more scientific data than previously believed.
Velikovsky realized that if his scenario was true, several predictions could be made about the astronomical bodies involved. After all, the merit of a theory is based on its predictive abilities. The predictions Velikovsky made were in total contradiction with the prevailing views of the time.
Decade after decade, space programs provided extra data that made it possible to test Velikovsky's claims. Unexpectedly, most of them turned out to be true. Some of the most noticeable predictions were the Jupiter radio signal, the Sun net electric charge and Earth's magnetosphere extending beyond the moon.
Analyzing all the true predictions made by Velikosvky is beyond the scope of this article, however.
Since we have already gathered information about a potential encounter between Mars and Earth, we will now focus on the last piece of puzzle: is Venus a comet? And, in particular, Velikovsky's predictions relative to the cometary nature of Venus.
The nature of Venus was the pivotal point of the controversy surrounding Worlds in Collision. If Venus was not a comet, the whole chain of events was impossible. Conversely, if Venus was indeed a comet, Velikovsky's Earth-Mars close encounter scenario becomes much more plausible.
Was Venus a Comet?
According to mainstream science, Venus is a sister planet of Earth and Mars. They formed the same way (via accretion), from the same material, in the same region, over the same time span. Contrary to this model, Velikovsky's predictions about Venus and its cometary nature were as follows:
- Venus is a hot planet because, until recently, it was a comet
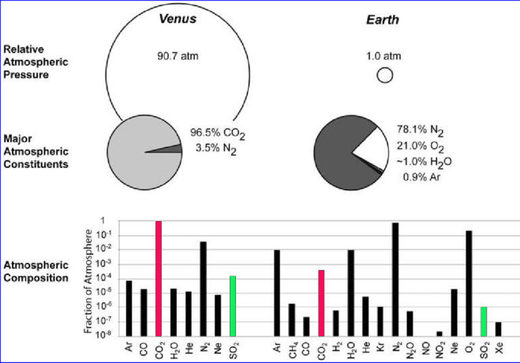
But when space probe Mariner 2 sent back its data in 1963, the scientific community was flabbergasted. Venus' average surface temperature was a whopping 462°C (864°F). The "habitable" planet had the temperature of molten lead!
The hot nature of Venus was confirmed in 1991, when Kiefer et al measured gravitational variations over Venus, from which they deduced that Venus' crust was very thin (10-20 km) compared to the crust of "sister" planets like Earth or Mars (50-100 km).
This thin lithosphere indicates that Venus has a hot, active interior that prevents the crust from cooling down and hardening over a substantial thickness.
In conclusion, as predicted by Velikovsky, Venus is indeed a hot planet, on the surface as well as inside. This strongly suggests that not long ago Venus was still a blazing hot comet and that it has not yet fully cooled down from its previous cometary state.
- Venus is a young planet because until recently it was a comet
But these were only assumptions because, at the time, the surface of Venus could not be directly observed due to its very dense atmosphere. In the 1970s, the first Venusian probes allowed direct observations of Venus' surface and revealed that Venus had a surprisingly low number of craters.
These repeated observations strongly suggest that, as predicted by Velikovsky, Venus is a young planet. Until recently it was still a comet, therefore not enough time in its "planet life" has elapsed for it to be impacted a large number of times.
- Venus should have an anomalous rotation
This prediction was, like the others, considered heresy. But in 1962, the US Naval Research Laboratory in Washington announced that Venus had a slow retrograde rotation. It is the only planet in the inner solar system to display a retrograde rotation.Confirming Venus' peculiar celestial movements, Goldreich et al demonstrated in a paper published in 1966 that Venus' spin was in resonance with Earth's orbit - each time Venus passes between the Sun and Earth, it shows the same side to Earth.
Such a resonance strongly suggests a relatively recent close approach between Earth and Venus, which "locked" the spin of the smaller planet with the orbit of the larger one. In addition, one of the main arguments that sought to refute Velikovsky's theory was that Keplerian orbits can not cross each other - so that collisions or near-collisions can't occur.
In a paper titled "Velikovsky and the sequence of planetary orbit", L.E. Rose et al demonstrated that not only can Keplerian orbits cross each other, but Venus could have had a highly elliptical (cometary) orbit in the recent past, that the solar system could have exhibited stable planetary orbits before the arrival of Venus, and that Venus could have acquired a circular orbit soon after its integration to the solar system.
- Venus' electrical activity
This was just the beginning of the revelations about Venus' electrical nature. In a paper published in Nature in 2007, Pätzold et al showed that Venus was also surrounded by an extensive ionosphere (the positively charged layer of a planet's atmosphere).
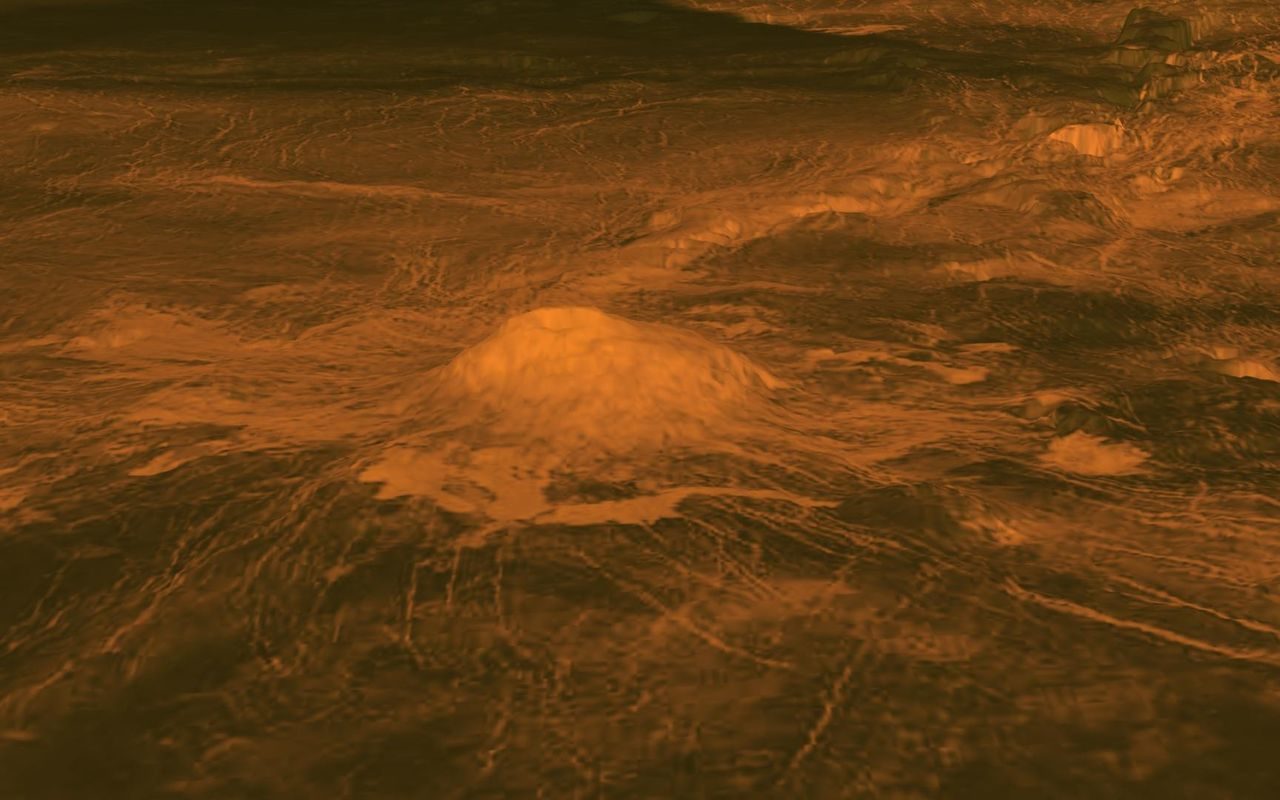
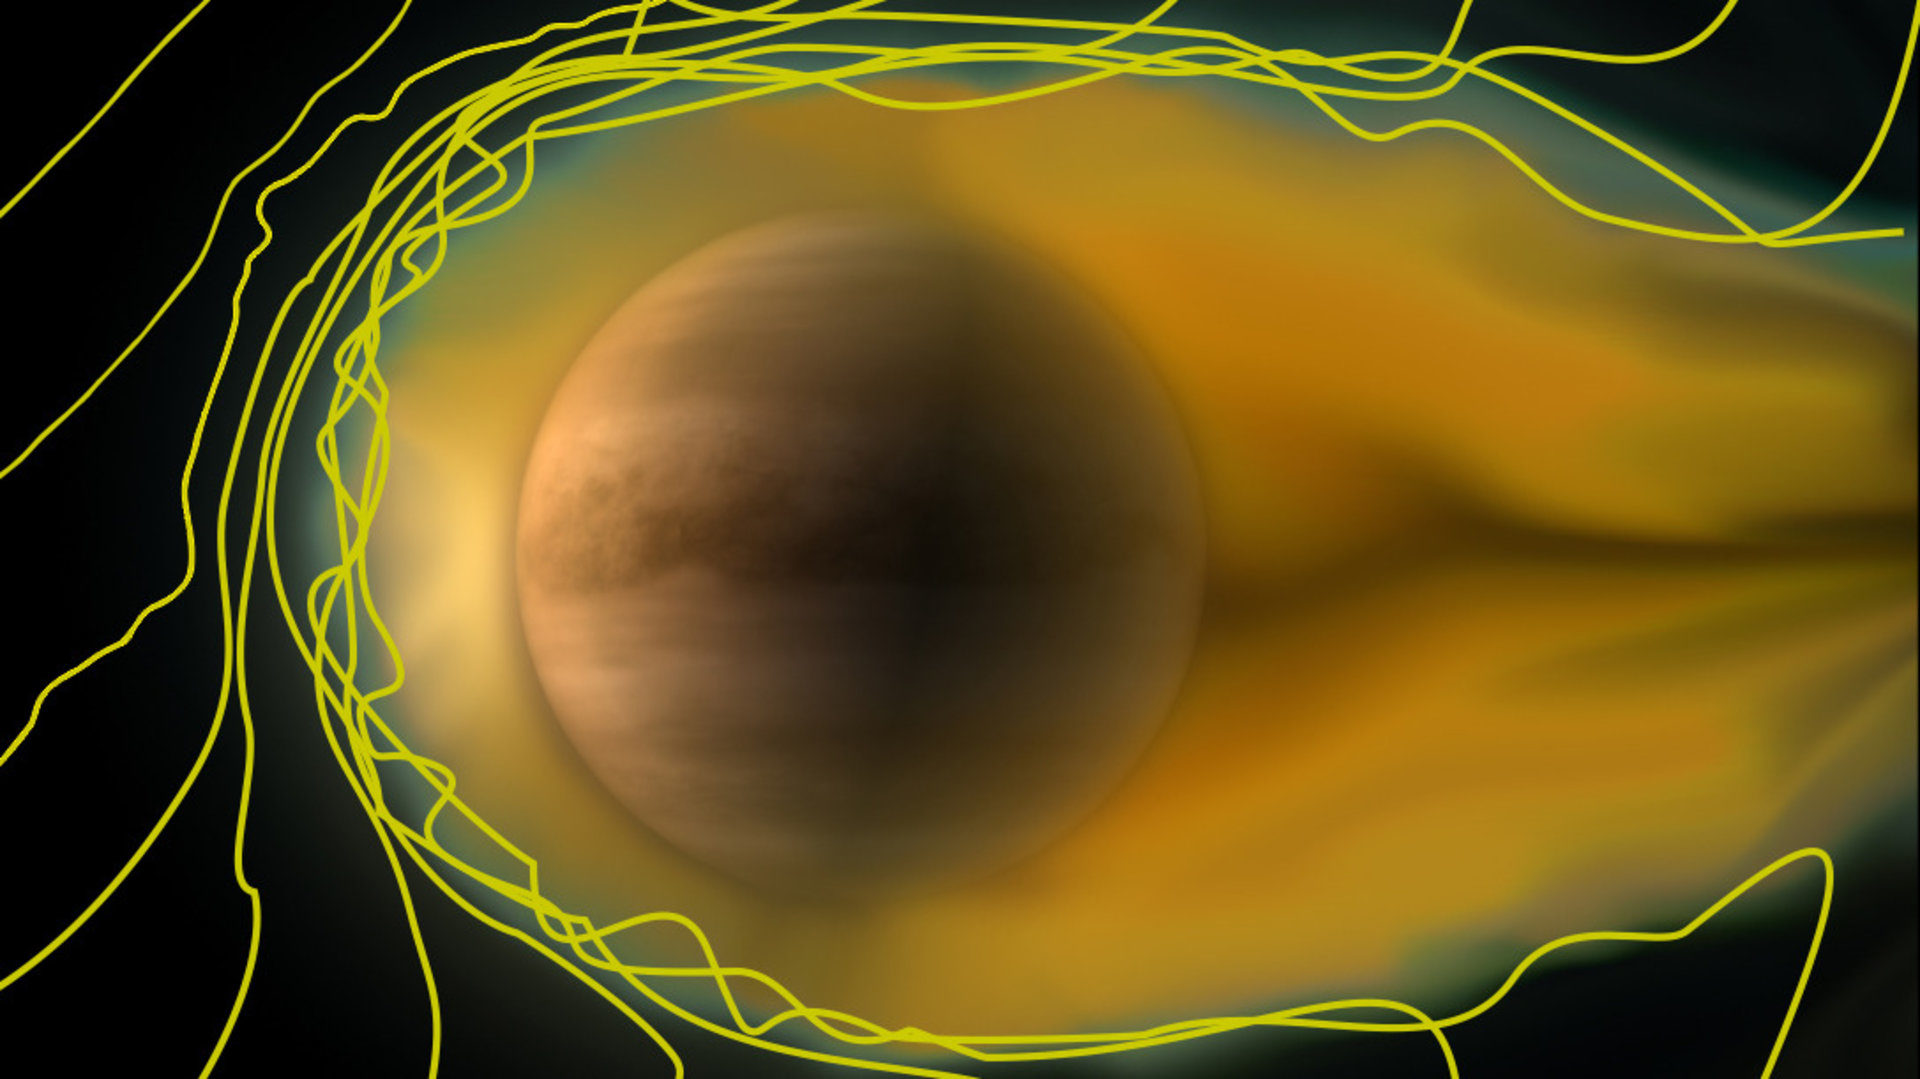
A few years later, in 2013, the European Space Agency announced that Venus did not have a normal spherical ionopshere but a teardrop-shaped ionosphere, i.e. a comet's tail, as illustrated by the image below.
Venus' comet tail is very long: 45 million km (29 million miles). So long in fact that its ion tail reaches Earth when the Sun, Venus and Earth are aligned.
Notice that Venus, originally a comet that finally settled along a stable orbit in the solar system, is not an isolated case. In chapter 21 of Earth Changes and the Human Cosmic Connection, we described in detail how several planets of our solar system have acquired a number of new moons that were previously cometary bodies:
N.B.: Since 2013, Jupiter has acquired 12 new moons. As of 2019, Jupiter has a total number of 79 moons.And Saturn has now 82 moons.
When Did The Water Transfer Occur?
We began this article with an "anomaly": during the Younger Dryas, a period of dramatic cooling, the sea level rose markedly instead of dropping (because of the increasing volume of ice). Since the hypothesis is that a massive dump of Martian ice can explain this anomaly, the close encounter with Mars should have happened soon after the beginning of the YD, which is dated to 12,900 B.P.
But are there other pieces of evidence that confirm this sequence of events and clarify the time that elapsed between the beginning of the YD (cometary bombardments) and the Mars encounter (ice and water dump)? As we will see below, several sources of information - among them ancient maps, reconstruction of past sea levels and past temperatures and moraine analysis - can give us a pretty clear idea of when the water transfer from Mars to Earth likely occurred.
Ancient Maps
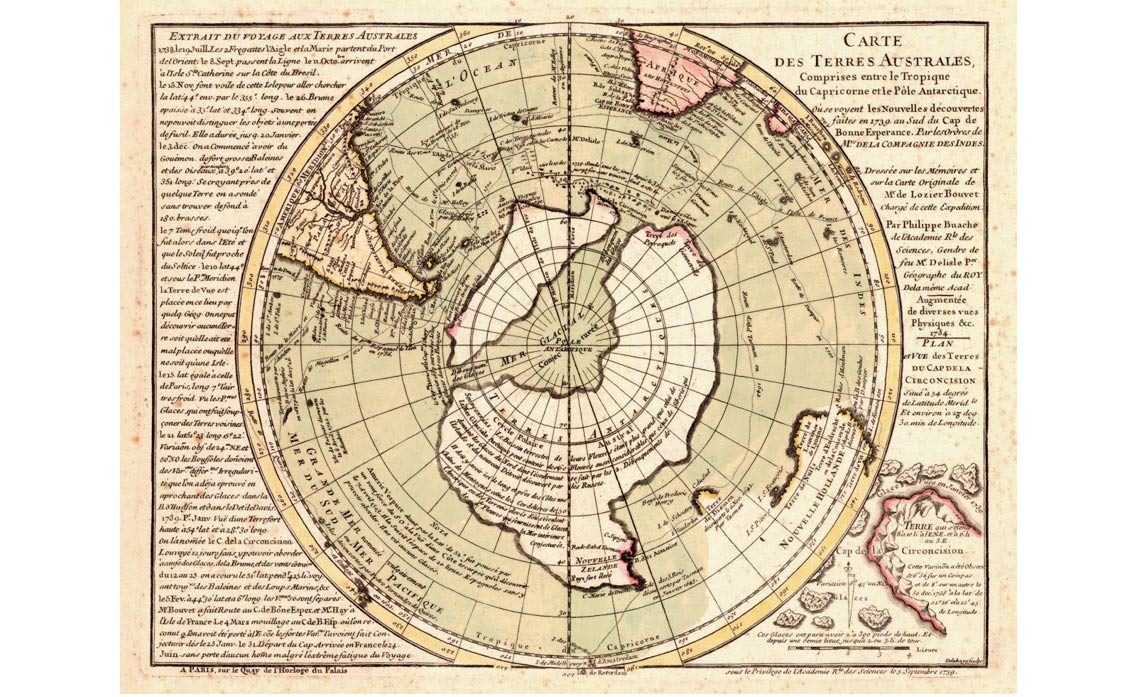
Several maps dating back to the Rennaisance show an ice-free Antarctica. Here we will focus on the Piri Reis map (dated to 1513), the Oronteus Finaeus map (1532) and the Buache map (1737).
The authenticity of these maps has been thoroughly tested. The book Maps of the Ancient Sea Kings by Charles Hapgood demonstrates that not only are the maps genuine, but also that the people who drew them had an excellent knowledge of longitudes, latitudes and spherical trigonometry, a branch of geometry that reached its complete form only at the end of the 19th century. It is also clear that the original designers of these maps had explored and surveyed the whole world and knew the exact size and circumference of our planet.
While these maps date back to the 16th century, Antarctica was only (re-)discovered three centuries later in 1820. This suggests that these three maps are Medieval copies of ancient original maps drawn at a time when Antarctica was indeed an ice-free continent. Also notice that the Buache map (above) shows an ice-free Antarctica comprised of two main islands.
20th century radar-mapping of the Antarctica rockbed has confirmed that Antarctica is not one solid single island, but rather an archipelago comprising two main islands.
Close examination of the Orontius Finaues map (below) reveals a number of river inlets and islands along the coast of Antarctica. These features are now under water. This suggests that at the time when the original Oronteus Finaues map was drawn, the sea level was noticeably lower than it is today.
In some cases, the features are now more than 120 meters under water. As shown in the image below, the only time over the last 125,000 years when water level was that low was about 15,000 years ago.
Were the originals of these maps drawn 15,000 years ago, when the water level was low enough for the now submerged land features to be exposed? If these ancients maps representing an ice-free Antarctica were drawn about 15,000 years ago, then the close encounter with Mars and the accompanying ice dump must have happened later.
Sediment analysis from Antarctica confirms that the original maps have to date to at least 6,000 years ago since the analysis of sediment cores from the Ross Sea reveal fine river sediments, i.e. non frozen/active rivers connecting to the Ross Sea at that time.
So we have a date range for the Mars encounter somewhere between 6,000 and 15,000 years ago. Can we narrow this range?
Sea Level And Temperatures
The sea level drop (about 30 meters) that should have been induced by the YD cooling (12,900 to 11,700 years ago) didn't happen, and we can hypothesize that it was offset by the intake of Martian water. To know more precisely when this intake might have occurred, however, we need to take a closer look at coral-based sea level analysis. The sea level graph at the beginning of this article displays a very smooth curve because it is the average sea levels based on the analysis of coral reefs.
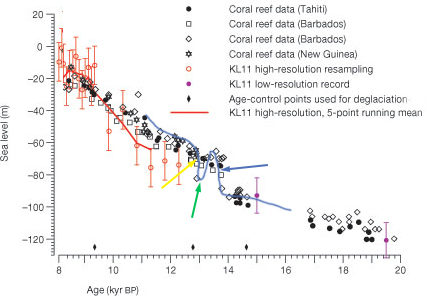
If we examine this coral reef data individually, it appears that it shows some variability. As shown by the chart below, each reef has its own history:
In the graph above, the Barbados coral records (blue line following the diamond symbols) show a steep increase (blue arrow) followed by a sudden trough (green arrow) quickly followed by a second steep increase (yellow arrow). There are only about 500 years between the two steep increases.
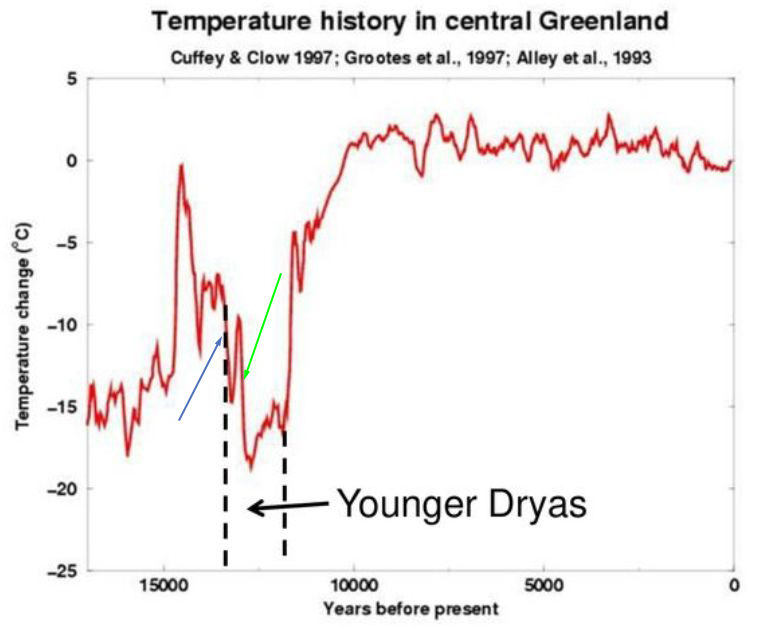
The reconstructed temperature history (based on the analysis of oxygen18 isotope) during the Younger Dryas reveals a very similar picture:
The graph above shows that the beginning of the Younger Dryas is marked first by a drastic cooling (blue arrow) followed, about four centuries later, by a second abrupt cooling (green arrow). Do the two consecutive spikes in temperature drops and sea level rise suggest two consecutive major cooling events? Like the cometary bombardment described in our previous article (c. 12,900 BP) and, a few centuries later, the Mars-Earth interaction (c.12,500 BP) described in this article?
Moraine Analysis
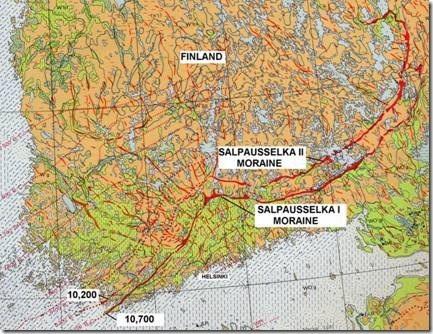
The quick succession of two major cooling events at the beginning of the YD seems to be confirmed by moraine analysis, as described by Anthony Watts in the following excerpt (moraines are geological formations that mark the limit of ice extent):
The Younger Dryas was not just a single climatic event. Late Pleistocene climatic warming and cooling not only occurred before and after the YD, but also within it. All three major Pleistocene ice sheets, the Scandinavian, Laurentide, and Cordilleran, experienced double moraine-building episodes, as did a large number of alpine glaciers. Multiple YD moraines of the Scandinavian Ice Sheet have long been documented and a vast literature exists. The Scandinavian Ice Sheet readvanced during the YD and built two extensive end moraines across southern Finland, the central Swedish moraines, and the Ra moraines of southwestern Norway(Fig. 4). 14C dates indicate they were separated by about 500 years.Beyond the case of the Scandinavian ice sheet, Loch Lomond in Scotland provides very similar evidence:
Anthony Watts, The intriguing problem of the Younger Dryas
Among the first multiple YD moraines to be recognized were the Loch Lomond moraines of the Scottish Highlands.[...]. The Loch Lomond moraines consist of multiple moraines. Radiocarbon dates constrain the age of the Loch Lomond moraines between 12.9k and 11.5k calendar years agoAncient maps, temperature and sea level reconstruction and moraine analysis all provide a consistent picture. The beginning of the YD seems to have been marked by two distinct catastrophic cooling events that happened in close succession:
- c.12,900 BP - A major cometary bombardment, as described in 'Flash-Frozen Mammoths', and generally accepted by modern science
- c.12,500 BP - A few centuries later, a close encounter between Earth and Mars and the accompanying water/ice dump (not generally accepted by modern science)
The information gathered above enables us to hypothesize a scenario for the second event (c.12,500 BP) that involves the following steps:
- Venus, a cometary body, enters the solar system and follows a typical eccentric cometary orbit around the Sun and Jupiter
- Comet Venus passes by Mars and disrupts its orbit
- Mars' disrupted orbit brings it very close to Earth
- The close proximity between Mars and Earth triggers a massive electric discharge, transferring Martian material, including most of its ocean, to Earth
This eccentric orbit passed close to Earth orbit and, during the first crossing, some of the bodies included in the swarm were attracted by Earth's gravity and provoked a substantial cometary bombardment with no less than five major meteors with diameters in excess of 10 km reaching Earth. This could be the catastrophic event (c.12,900 B.P.) that initiated the Younger Dryas.
Because of its higher momentum, Venus then pursued its orbit around the Sun and Jupiter. After 7-10 revolutions (350-500 years), Venus came very close to Mars, knocked it out of its orbit and pushed it dangerously close to Earth, leading to the electric discharge described above.
This scenario is close to the one proposed by Velikovsky 70 years ago. The only substantial differences are the water transfer and, of course, the dating. In fact, the dating was the main argument brought against Velikovsky (who suggested a timeframe of c. 3,500-2,800 B.P.). It is still the main bone of contention today, as illustrated by this excerpt of the Wikipedia page about Velikovsky's book:
So far, the only piece of the geologic evidence which has shown to have a catastrophic origin is a "raised beach" containing coral-bearing conglomerates found at an elevation of 1,200 feet above sea level within the Hawaiian Islands.The more recent dating suggested by Velikovsky isn't backed up by much evidence in the form of major catastrophes affecting the whole planet (although there is a good case for a localized catastrophe in the Middle East that marked the end of the Bronze Age).
The sediments, which were misidentified as a "raise beach", are now attributed to megatsunamis generated by massive landslides created by the periodic collapse of the sides of the islands. In addition, these conglomerates, as many of the items cited as evidence for his ideas in Earth in Upheaval, are far too old to be used as valid evidence supporting the hypothesis presented in Worlds in Collision.
On the other hand, the onset of the Younger Dryas (c.12,900-12,500 BP) offers plenty of evidence for sudden and major changes over the entire planet.
Velikovsky considered that the second event, a close encounter between Mars and Earth and its accompanying water/ice dump, was referenced in mythology as the Great Flood. He based his dating mostly on the chronology offered by the Old Testament (c. 2,800 BP). But the Hebrew mythology as recorded in the Old Testament is only one of numerous mythologies mentioning the Great Flood. In 500 cultures spanning all continents, researcher Douglas Eddinger found that about 90% of them included an account of a 'great deluge'. The prevalence of this myth in most cultures all across the planet suggests that the Deluge was truly a worldwide catastrophe.
The Old Testament is not the oldest account of the Great Flood. It is predated by the ancient Mesopotamian Gilgamesh epic (Utanapishtim's Tale, tablet XI), which is about 5,000 years old.
According to University of Chicago professor A. Heidel, author of The Gilgamesh Epic and the Old Testament Parallels, Mesopotamian and Hebrew myths could descend from an even older common original. In any case, the written version of the Epic was preceded by oral versions. Beyond the age of written history, traces of accounts of the catastrophic events that set the Younger Dryas can be still found, even in the oldest archeological neolithic site.
Gobekli Tepe is an archeological site located in southern Turkey. Its deepest layer dates back to c. 10,000 BP. Its major archeological feature is the vulture stone, a massive carved pillar also known as pillar 43 (image below).According to University of Edinburgh lead researcher Martin Sweatman, the vulture stone is a astronomic representation where, like today, animals represent constellations and the whole scene displays a cosmic catastrophe. Computer model analysis carried out to match the patterns of the stars detailed on the Vulture Stone points to one specific date: 12,950 BP, which is exactly the date of the onset of the Younger Dryas.














But if we had true science going on from the time of Velikovsky to now (the reactions he received and slanders he suffered seem to correlate quite well to when true science became 'classified' - to be kept by authoritarian governments / PTBs etc.
He likewise said we acquired vermin from Venus. Given the 'E.T.' nature of cockroaches and how EVERYONE naturally recoils from them, contra to even a rhino beetle or a lady bug (all considered beetles) it seems to me that if roaches were as prevalent then as they are now, we'd have more ancient records of them than we do; although I've not researched it.
Sure we've got locusts/grasshoppers, and here in Florida, we have Lubbers - which are giant 3" long bright yellow grasshoppers with and bright red wings, which move super slowly, which do NOT creep everyone out like cockroaches do.
R.C.