Translated & edited by P Gosselin
No Tricks ZoneSun, 08 Nov 2015 22:28 UTC

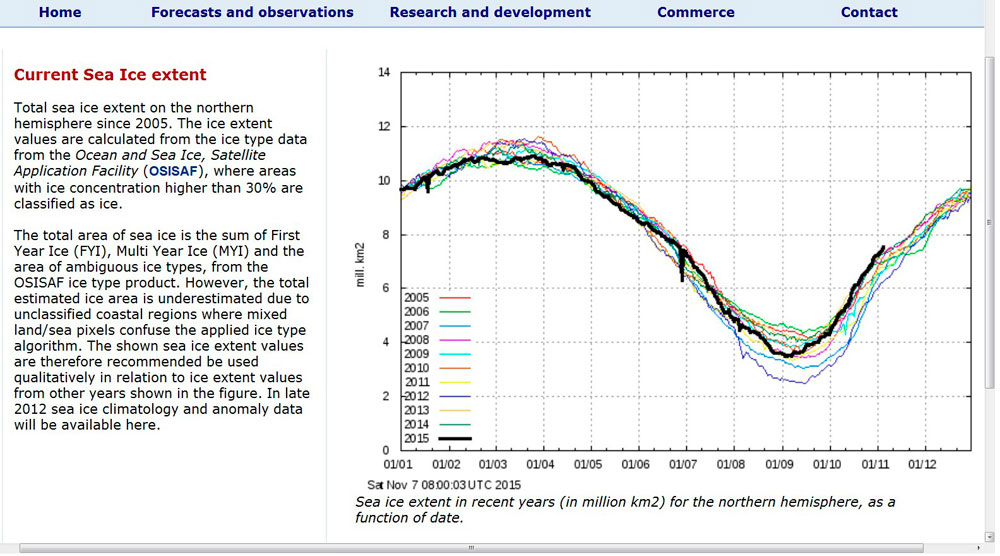
© dmi.dkThe DMI chart for sea ice extent (30% and more) shows that it is now (7 November 2015 – black line) considerably more than at any time for the date over the past 11 years.
With an ice extent of 8 million square kilometers at the start of November, the Arctic has reached the highest sea ice extent of the last eleven years. A chart (above) from the Danish Meteorological Institute (DMI) clearly shows the highest extent for sea ice cover with 30% or more ice on 7 November 2015.
This chart comes as no surprise for those who have been monitoring the weather and ice developments in the North Atlantic and Greenland.
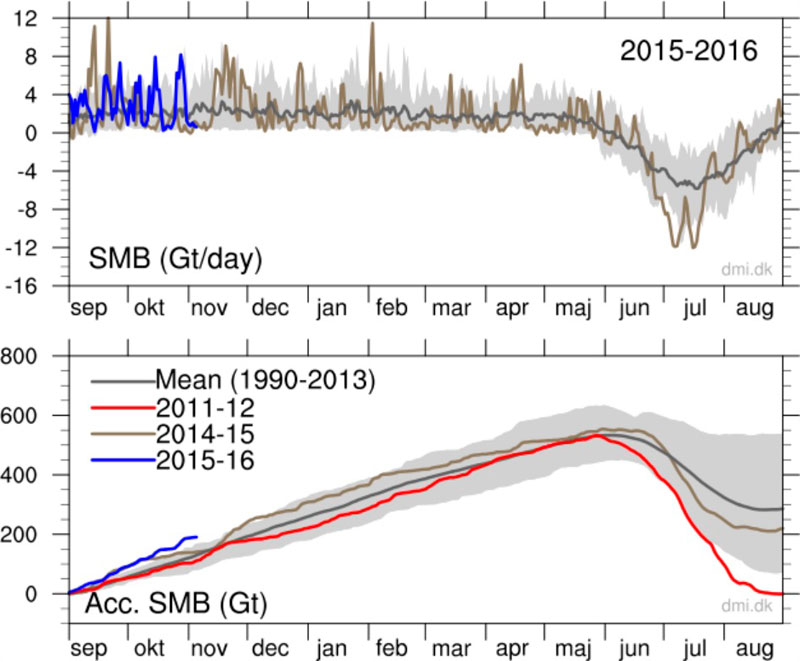
The net growth of the Greenland ice sheet, which surely is a surprise for many, saw an increase in October of approximately
200 km³ (200 billion cubic meters) since September 1, 2015, i.e.
in just 2 months:

© dml.dkThe gross mass balance of Greenland’s ice shows a growth of 200 cubic kilometers just since September 1 2015 (blue line in the lower chart). The brown line in the lower chart ends on the right side at 31 August 2015 and shows a gross ice mass growth of approximately 230 km³.
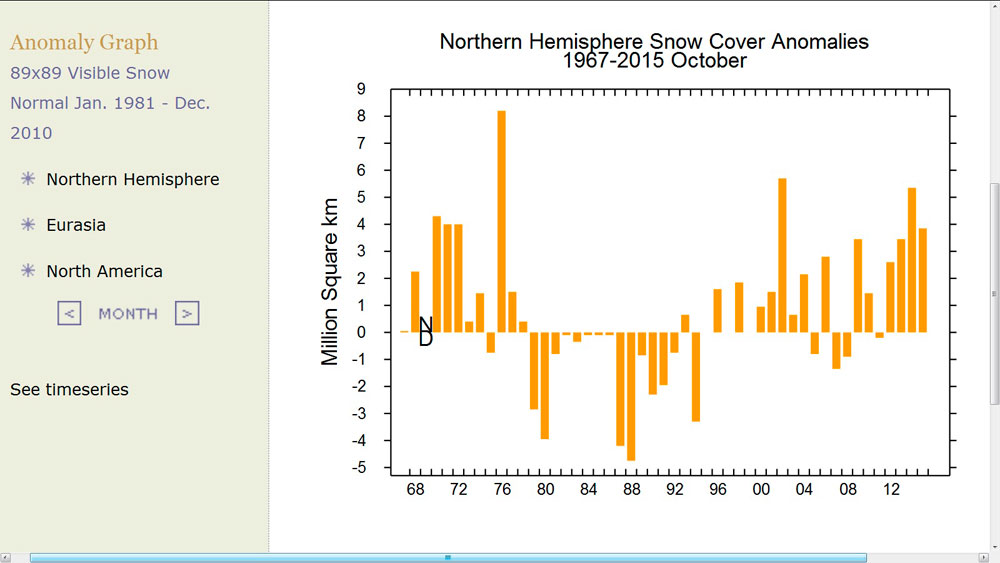
Moreover snow coverage of the northern hemisphere is telling us the same story. In October 2015, at 21.4 million square kilometers, it was the fourth greatest extent since measurements began in 1967, and is
4 million km² above the international WMO 1981-2010 mean:

© dml.dkNorthern hemisphere snow and ice coverage in October 2015 is close to 4 million square kilometers above the WMO 1981-2010 mean, placing it at no. 4 since record keeping began in 1967. The chart shows an increase in October northern hemisphere snow coverage of close to 9 million square kilometers.
Comment: The once high hyped canary-in-the-coal mine Arctic is just not getting much attention from the alarmists this year - because it is doing the very opposite of what they predicted!


This planet is truly abundant. We have a huge stash of water to call upon, if needs be. We have natural incinerators called volcanoes in which to dump our waste. We have ample food for everyone if the resources are managed properly. The fault is not with the climate, nature, the planet or God....
Humanity with its closed mind-frames and tunnel vision is humanity's worst enemy. We should teach ourselves to think both within and outside the usual parameters; both inside and outside the 'box', so to speak.