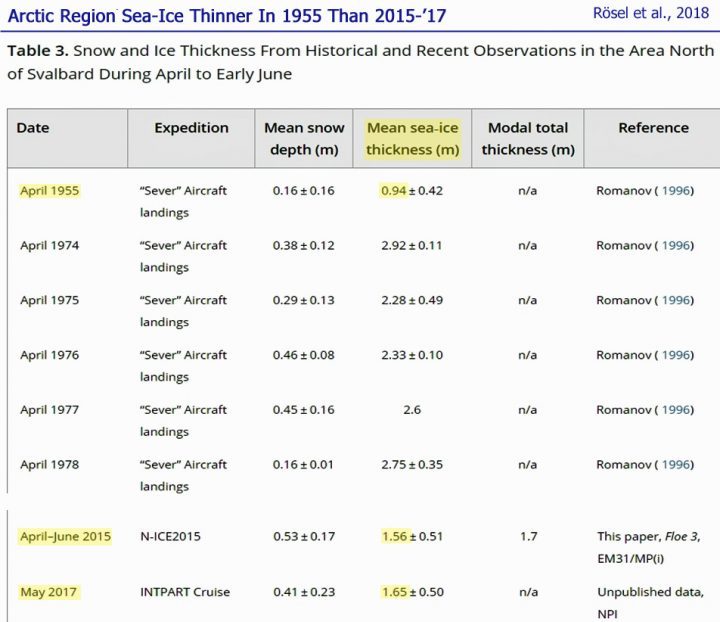
According to a new paper published in the Journal of Geophysical Research, the observed mean thickness of the sea ice in the region north of (Arctic) Svalbard was substantially thinner (0.94 m) in 1955 than it has been in recent years (~1.6 m, 2015/2017).
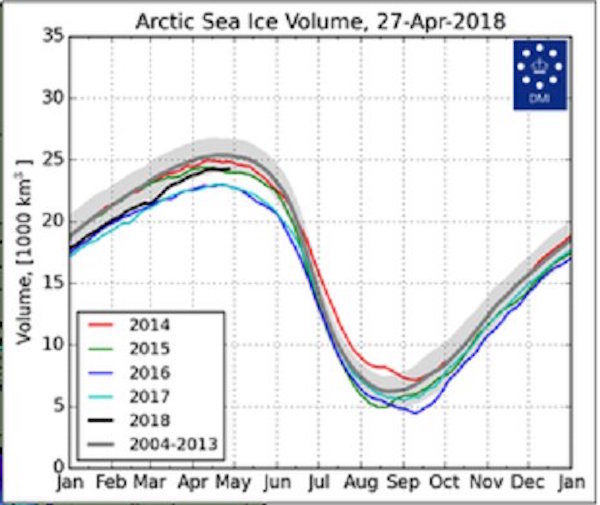
Graph Source: Rösel et al., 2018
In 1955, the atmospheric CO2 concentration hovered around 315 ppm, about 90 ppm lower than today's CO2 values.
It is widely assumed that the steep and substantial rise in CO2 concentration since the 1950s is largely responsible for warming the Arctic, and consequently the decline in the Arctic's sea ice volume and extent (IPCC, 2013). This assumption is significantly predicated on the observation that sea ice has undergone precipitous losses since the 1970s, which is when the satellite era began.
More at No Tricks Zone
The paper, open access: https://agupubs.onlinelibrary.wiley.com/doi/full/10.1002/2017JC012865
Thin Sea Ice, Thick Snow, and Widespread Negative Freeboard Observed During N‐ICE2015 North of Svalbard Abstract
In recent years, sea‐ice conditions in the Arctic Ocean changed substantially toward a younger and thinner sea‐ice cover. To capture the scope of these changes and identify the differences between individual regions, in situ observations from expeditions are a valuable data source. We present a continuous time series of in situ measurements from the N‐ICE2015 expedition from January to June 2015 in the Arctic Basin north of Svalbard, comprising snow buoy and ice mass balance buoy data and local and regional data gained from electromagnetic induction (EM) surveys and snow probe measurements from four distinct drifts. The observed mean snow depth of 0.53 m for April to early June is 73% above the average value of 0.30 m from historical and recent observations in this region, covering the years 1955-2017. The modal total ice and snow thicknesses, of 1.6 and 1.7 m measured with ground‐based EM and airborne EM measurements in April, May, and June 2015, respectively, lie below the values ranging from 1.8 to 2.7 m, reported in historical observations from the same region and time of year. The thick snow cover slows thermodynamic growth of the underlying sea ice. In combination with a thin sea‐ice cover this leads to an imbalance between snow and ice thickness, which causes widespread negative freeboard with subsequent flooding and a potential for snow‐ice formation. With certainty, 29% of randomly located drill holes on level ice had negative freeboard.


Comment: The cooling observed in the Arctic is happening all around the planet: