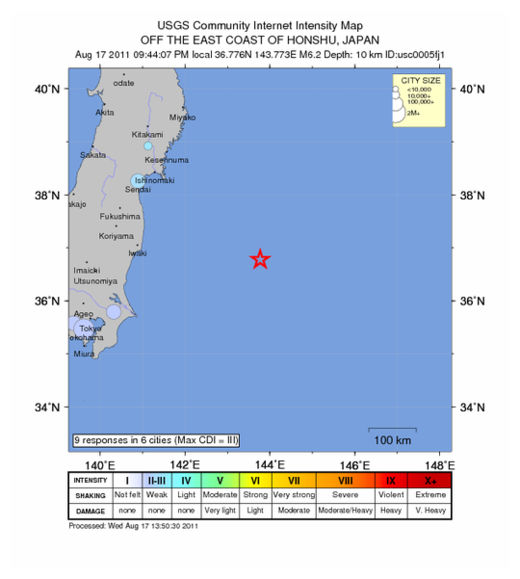
NASA Earth Observatory Image by Jesse Allen and Robert Simmon, using data from the USGS Earthquakes Hazard Program and Oak Ridge National Laboratory Geographic Information Science and Technology.
This map shows the ground motion and shaking intensity from the earthquake at dozens of locations across Japan. Each circle represents an estimate of shaking as recorded by the USGS, in conjunction with regional seismic networks. Shades of pale yellow represent the lowest intensity and deep red represents high intensity. The ground shaking data is overlaid on a map of population density provided by Oak Ridge National Laboratory.
A shaking intensity of VI is considered "strong" and can produce "light damage," while a IX on the scale is described as "violent" and likely to produce "heavy damage." The pattern of shaking appears to run parallel to the offshore subduction trench, with the intensity decreasing more from east to west, as opposed to north and south. Ground motion also seems to be more intense in coastal and riverine areas, where settlements are built on softer sediments and less bedrock.
Comment: If people in the California area are not awake enough to take these VERY strong indicators that the West Coast of the USA is next in line for a major quake then what can ANYONE do to help them?