
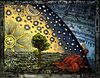
© Solar Dynamics Observatory HMI ContinuumThe blank sun
Today at Cape Canaveral, SpaceX launched a new sensor to the International Space Station named TSIS-1. Its mission: to measure the dimming of the sun's irradiance. It will replace the aging SORCE spacecraft. NASA SDO reports that as the sunspot cycle plunges toward its 11-year minimum, NASA satellites are tracking a decline in total solar irradiance (TSI).
Across the entire electromagnetic spectrum, the sun's output has dropped nearly 0.1% compared to the Solar Maximum of 2012-2014. This plot shows the TSI since 1978 as observed from nine previous satellites:

© NASA
What do we learn from these plots? First, TSI does change! That's why we stopped calling it the solar constant. Second, as the sunspot number increases, so does TSI. But the converse is also true. As the sunspot number decreases so does TSI. We have watched this happen for four sunspot cycles. This waxing and waning of TSI with sunspot number is understood as a combination of dark sunspots reducing TSI below the dashed line and long-lived magnetic features increasing TSI. SORCE has even observed flares in TSI.
Third, the horizontal dashed line is not an average, it is drawn at the lowest value in the year-averaged TSI data (that happened in 2009). When there are no sunspots the Sun's brightness should be that of the hot, glowing object we always imagined it to be. We would expect TSI to be the same at every solar minimum. There is much discussion over whether the value of TSI at solar minimum is getting smaller with time, but it is not getting larger.
These data show us that the Sun is not getting brighter with time. The brightness does follow the sunspot cycle, but the level of solar activity has been decreasing the last 35 years. The value at minimum may be decreasing as well, although that is far more difficult to prove. Perhaps the upcoming solar minimum in 2020 will help answer that question.
The rise and fall of the sun's luminosity is a natural part of the solar cycle. A change of 0.1% may not sound like much, but the sun deposits a lot of energy on the Earth, approximately 1,361 watts per square meter. Summed over the globe, a 0.1% variation in this quantity exceeds all of our planet's other energy sources (such as natural radioactivity in Earth's core) combined. A 2013 report issued by the National Research Council (NRC), "The Effects of Solar Variability on Earth's Climate," spells out some of the ways the cyclic change in TSI can affect the chemistry of Earth's upper atmosphere and possibly alter regional weather patterns, especially in the Pacific.
NASA's current flagship satellite for measuring TSI, the Solar Radiation and Climate Experiment (SORCE), is now more than six years beyond its prime-mission lifetime. TSIS-1 will take over for SORCE, extending the record of TSI measurements with unprecedented precision. It's five-year mission will overlap a deep Solar Minimum expected in 2019-2020. TSIS-1 will therefore be able to observe the continued decline in the sun's luminosity followed by a rebound as the next solar cycle picks up steam. Installing and checking out TSIS-1 will take some time; the first science data are expected in Feb. 2018.
In other news, as the magnetic activity of the sun decreases, influx of Galactic Cosmic Rays (GCR's) increase as has been observed by balloon measurements over California:

© NASA
The radiation sensors onboard our helium balloons detect X-rays and gamma-rays in the energy range 10 keV to 20 MeV. These energies span the range of medical X-ray machines and airport security scanners.
The data points in the graph above correspond to the peak of the Reneger-Pfotzer maximum, which lies about 67,000 feet above central California. When cosmic rays crash into Earth's atmosphere, they produce a spray of secondary particles that is most intense at the entrance to the stratosphere. Physicists Eric Reneger and Georg Pfotzer discovered the maximum using balloons in the 1930s and it is what we are measuring today.


A aluminum or carbon fiber can is not going to protect your health whilst gasping vast amounts of the air up there...
But, you do like the jet rides don't you?
I bet someone has a plan about all this........