Our paper
Limits on CO2 Climate Forcing from Recent Temperature Data of Earthhas just been published in Energy and Environment. (Vol 20, Jan 2009). [Copies may be downloaded from
here . preprint with figures in color
here]
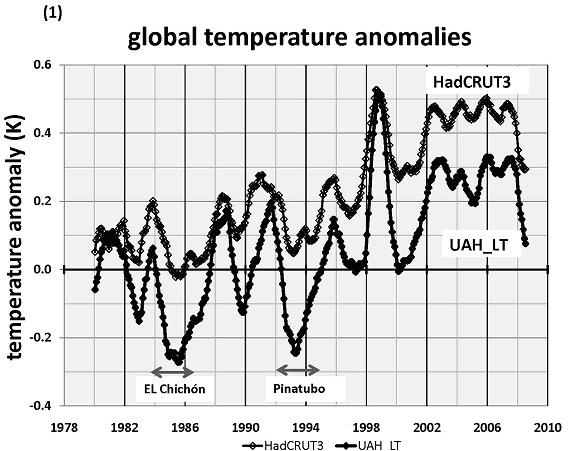
We show in Figure 1 the well established observation that the global atmospheric temperature anomalies of Earth reached a maximum in 1998.

© David Douglass and John Christy
This plot shows oscillations that are highly correlated with El Nino/La Nina and volcanic eruptions. There also appears to be a positive temperature trend that could be due to CO2 climate forcing.
We examined this data for evidence of CO2 climate forcing. We start by assumed that CO2 forcing has the following signature.
1. The climate forcing of CO2 according to the IPCC varies as ln(CO2) which is nearly linear over the range of this data. One would expect that the temperature response to follow this function.
2. The atmospheric CO2 is well mixed and shows a variation with latitude which is less than 4% from pole to pole. Thus one would expect that the latitude variation of the temperature anomalies from CO2 forcing to be also small.
Thus, changes in the temperature anomaly T that are oscillatory, negative or that vary strongly with latitude are inconsistent with CO2 forcing.
The latitude dependence of the UAH data is shown in Figure 2.

© David Douglass and John Christy
The anomalies are for NoExtropics, Tropics, SoExtropics and Global. The average trends are 0.28, 0.08, 0.06, and 0.14 K/decade respectively. If the climate forcing were only from CO2 one would expect from property #2 a small variation with latitude. However, NoExtropics is 2 times that of the global and 4 times that of the Tropics. Thus one concludes that the climate forcing in the NoExtropics includes more than CO2 forcing. These non-CO2 effects include: land use [Pielke et al. 2007]; industrialization [McKitrick and Michaels 2007, Kalnay and Cai 2003, DeLaat and Maurellis 2006]; high natural variability, and daily nocturnal effects [Walters et al. 2007].
Thus we look to the tropical anomalies. If one is able to determine an underlying trend in the tropics, then assuming that the latitude variation of the intrinsic CO2 effect is small (CO2 property #2), then the global trend should be close to this value.
Figure 3 shows the tropical UAH data and the nino3.4 time-series. (Results consistent with these were found using RSS microwave temperatures, but evidence also presented here and elsewhere indicates RSS is less robust for trend calculations.)

© David Douglass and John Christy
One sees that the value at the end of the data series is less than at the beginning. However, one should not conclude from this observation that the trend is negative because of the obvious strong correlation between UAH and nino3.4.
The desired underlying trend, the ENSO effect, the volcano effect can all be determined by a multiple regression analysis. The regression analysis yields the underlying trend
trend = 0.062±0.010 K/decade;
R
2 = 0.886. (1)
Warming from CO2 forcingHow big is the effect from CO
2 climate forcing? From IPCC [2001]
Δ
T (
CO2 ) ≈λ* Δ
F (
CO2 ) (2)
Δ
F (
CO2 ) ≈ 5.33 ln (
C/
C0)*
where
l is the climate sensitivity parameter whose value is 0.30 ºK/(W m
-2) for no-feedback;
C is the concentration of CO
2, and
C0 is a reference value. From the data the mean value of the slope of ln(C(t)/C(t
0)) vs. time from 1979 to 2004 is 0.044/decade.
Thus,
Δ
T (
CO2 ) ≈ 0.070 K/decade (3)
This estimate is for no-feedback. If there is feedback leading to a gain
g, then multiply Eq. 3 by
g. The underlying trend is consistent with
CO
2 forcing with no-feedback. It is frequently argued that the gain
g is larger than 1, perhaps as large as 3 or 4. This possibility requires there to be some other climate forcing of negative sign to cancel the excess. From the results of Chylek [2007], this cancellation cannot come from aerosols. One candidate is the apparent negative feedback associated with changes in cirrus clouds when warmed [Spencer
et al. 2007].
Reader Comments
to our Newsletter