Earth ChangesS

Crusader

More Check Kiting at Nature

Nature has published another remarkable example of academic check kiting by Michael Mann et al, this time "Atlantic hurricanes and climate over the past 1,500 years". (Prior examples of academic check kiting discussed at CA are Ammann and Wahl, the story of which is well told by Bishop Hill's Caspar and the Jesus Paper and "Mann, Bradley and Hughes 2004", cited in Jones and Mann 2004.)

Mann et al 2009 reconstructs Atlantic tropical cyclone counts resulting in a curve that looks pretty much like every other Mannian curve. Atlantic tropical cyclone counts as a linear combination of reconstructed Atlantic SST in the east tropical Atlantic "main development region" (MDR), reconstructed El Nino and reconstructed North Atlantic Oscillation, using a formula developed in (3,16) - which surprisingly enough turn out to be articles by Mann himself (Mann and Sabatelli, 2007; Sabatelli and Mann 2007) previously discussed at Climate Audit here. This is summarized in the article as follows:
An independent estimate of past tropical cyclone activity was obtained using a statistical model for Atlantic tropical cyclone counts. This previously developed and validated 3,16 statistical model conditions annual Atlantic tropical cyclone counts on three key large-scale climate state variables tied to historical variations in Atlantic tropical cyclone counts: (1) the SST over the main development region (MDR) for tropical Atlantic tropical cyclones, which reflects the favourability of the local thermodynamic environment; (2) the El Nino/Southern Oscillation (ENSO), which influences theamount of (unfavourable) vertical wind shear; and (3) the North Atlantic Oscillation (NAO), which affects the tracking of storms, determining how favourable an environment they encounter. The statistical model was driven by proxy-based reconstructions17,18 of these three state variables (Fig. 2), yielding a predicted history of Atlantic tropical cyclone counts for past centuries.

Attention

Historical analysis looks for storm activity trends

Atlantic hurricanes have developed more frequently during the last decade than at any point in at least 1,000 years, a new analysis of historical storm activity suggests.

The new study, published today in Nature, attempts to reconstruct Atlantic hurricane activity back to the year 500. In doing so the authors found one era, a medieval period around the year 1000, when storm activity matched or exceeded recent hurricane seasons that included storms such as Katrina and Rita.

The scientists used two methods to reconstruct hurricane activity from a period when there were no satellites, reliable ship records or coastal residents taking notes.

One tack is based on the observation that the powerful storm surge of large hurricanes deposits distinct layers of sediment in coastal lakes and marshes. By taking cores of sediments at the bottom of these lakes, which span centuries, scientists believe they can tell when large hurricanes made landfall at a particular location.

The second method used a computer model to simulate storm counts based upon historical Atlantic sea surface temperatures, El Niรฑos and other climate factors.

Blackbox

Hurricanes on Ice - A Hurricane Hockey SHTICK by Michael Mann

By Eric Berger
Houston Chronicle
Aug. 12, 2009, 8:34PM

Historical analysis looks for storm activity trends
Atlantic hurricanes have developed more frequently during the last decade than at any point in at least 1,000 years, a new analysis of historical storm activity suggests.

The new study, published today in Nature, attempts to reconstruct Atlantic hurricane activity back to the year 500. In doing so the authors found one era, a medieval period around the year 1000, when storm activity matched or exceeded recent hurricane seasons that included storms such as Katrina and Rita.

The scientists used two methods to reconstruct hurricane activity from a period when there were no satellites, reliable ship records or coastal residents taking notes.

One tack is based on the observation that the powerful storm surge of large hurricanes deposits distinct layers of sediment in coastal lakes and marshes. By taking cores of sediments at the bottom of these lakes, which span centuries, scientists believe they can tell when large hurricanes made landfall at a particular location.

The second method used a computer model to simulate storm counts based upon historical Atlantic sea surface temperatures, El Ninos and other climate factors.

Findings consistent

The two independent estimates of historical storm activity were consistent, said Pennsylvania State University climate scientist Michael Mann, the paper's lead author. Both, for example, pinpointed a period of high activity between 900 and 1100.

"This tells us these reconstructions are very likely meaningful," he said.

This is not Mann's first attempt to use "proxies" for actual observations of conditions to tease out historical climate details. He was among the scientists whose global temperature reconstruction of the last 1,000 years - dubbed the "hockey stick graph" because it showed a distinct upward trend since the mid-19th century attributed to greenhouse gases - received both praise and criticism.

'Erroneous conclusions'

Now he appears to be doing the same with hurricane activity, and the new work is not without its detractors.

"The paper comes to very erroneous conclusions because of using improper data and illogical techniques," said Chris Landsea, science and operations officer at the National Hurricane Center. In his criticism, Landsea notes that the paper begins by saying that Atlantic tropical activity has "reached anomalous levels over the past decade."

This ignores recent work by Landsea and a number of other hurricane scientists who found that storm counts in the early 1900s - in an era without satellites and fewer seaborne observers - likely missed three or four storms a year. The addition of these storms to the historical record, he said, causes the long-term trend over the last century to disappear.

"This isn't a small quibble," he said. "It's the difference between a massive trend with doubling in the last 100 years, versus no trend."

Limits to usefulness?

Other scientists suggested that the new Nature paper does the best it can in deriving information about historical hurricane activity from a scant amount of data.

Yet this limits how useful the information is, said Rob Korty, an atmospheric scientist at Texas A&M University.

"The bottom line is that I think their work adds new and helpful information," said Korty. "But we must keep in mind the assumptions this kind of work require are large by nature."

Cloud Lightning

Tropical Storm Bill forms as Ana races west

Miami - The government of the Netherland Antilles issued a tropical storm watch for St. Maarten, Saba and St. Eustatius on Saturday as Ana raced west through the Atlantic.

Meanwhile, Tropical Storm Bill, the second named storm of the Atlantic season, formed further to the east and forecasters said they expected it to strengthen.

The National Hurricane Center said Saturday evening that Ana had maximum sustained winds near 40 mph and was moving west near 17 mph. It was about 730 miles east-southeast of the Leeward Islands.

Bizarro Earth

Evidence of a strong multiyear cooling trend over North America

North America Temp trend
© NCEP/NCAR

The slideshow at the bottom shows the temperature anomalies for the past 4 years between June 1 and August 7. A common feature is the warm spot over Greenland which is a signature of a Negative NAO. Opposite of winter when such a condition would be very cold there is a strong correlation to southern summer heat between the months of June and August.

While it is expected to be cool from in the regions in yellow note that the correlation is significant in fairly small areas (brightest yellow) compared to the south US where the heat is quite strongly favored.

The strong cooling evident in recent years is most likely a product of the current deep solar minimum and decline in irradiance which we are experiencing. While proclamation of a coming Ice Age is premature it is clear that the unexpected quieting of the sun is the most likely explanation for what appears to be a cooling trend.

Display

In computer models we trust!

The coming Senate vote on the badly misnamed Carbon Pollution Reduction Scheme (CPRS) is the culmination of intense propaganda spanning more than three decades. The Senate Bill aims at restricting emissions of carbon dioxide, a colourless, odourless gas essential to life, and has nought to do with smokestack carbon particles and other pollutants that have been regulated since the 1950s. The basis of the Bill is an unsustainable hypothesis that dangerous global warming will be an outcome of continued burning of fossil fuels and the rising concentrations of carbon dioxide in the atmosphere.

It is nearly 20 years since the UN's Intergovernmental Panel on Climate Change (the IPCC) in 1990 gave its first assessment of the likelihood and potential magnitude of human-caused global warming. In their first report in 1990 they confirmed that humans would have an impact on global temperatures as carbon dioxide levels increased. Importantly, the magnitudes of impacts were considered conjectural and subject to large uncertainty, because computer models of the time were rudimentary in their ability to represent the complex processes in the climate system.

The IPCC's second report in 1995 was more confident, saying that the balance of evidence suggested a discernible human influence on global climate. By the time of the 2001 third report the IPCC was concluding that the ability of computer models to project future climate had increased and 'the warming over the past 100 years is very unlikely to be due to internal variability alone, as estimated by current [computer] models'.

Evil Rays

It's all in the rocks

Here's the simple lesson in geology that all politicians need

Planet Earth is a warm wet greenhouse volcanic planet. The planet is dynamic, change is normal.

For less than 20% of its history Earth has had ice, five of the six major ice ages occurred when the atmospheric carbon dioxide (CO2) content was up to 1,000 times higher than at present, and for half of Earth history CO2 has been sequestered naturally into algal reefs, coral reefs, sediments, altered rocks, bacteria, plants, soils and oceans.

The Earth's atmospheric CO2 initially derived from volcanic degassing. Much of it still does and the rest is recycled CO2 from the oceans, rocks and life.

At present we enjoy a period of volcanic quiescence, but one big volcanic eruption can add as much CO2 to the atmosphere in a day as humans do in a year. Submarine supervolcanoes constantly pump out heat and CO2 into ocean waters, the effects of which are commonly not seen for thousands of years.

Compass

'Global weirdness' a weird way to argue with the weather facts

On June 24, 1974, Time magazine published a story titled "Another Ice Age?" The article reported in its lead, "When meteorologists take an average of temperatures around the globe they find that the atmosphere has been growing gradually cooler for the past three decades. The trend shows no indication of reversing."

I grew up in Florida where my parents were citrus growers on a 150-acre farm. A series of freezes in the 1970s and early 1980s seriously damaged Florida crops. On Christmas Eve night in 1983, a severe freeze came along when the temperature plummeted to 18 degrees and destroyed my parents' citrus trees and sole source of income. My wife and I were there and witnessed the results of the weather's devastation on Christmas morning. All of those trees were later bulldozed and burned.

According to the National Weather Service, Muncie, Anderson, South Bend and Fort Wayne recorded their lowest average monthly temperatures for July since official record keeping started in the 1890s. The average temperature in Indianapolis of 70.9 degrees was the second coolest on record, just 0.3 degrees warmer than the July of 1947. It was also the coldest July on record in Illinois. The statewide average temperature for July was 70.4 degrees, 5.3 degrees below normal and a degree colder than the previous record set in 1924 (71.5 degrees). Use "July temperatures" as an Internet search term, and you will find dozens of newspaper articles about record or near-record cool temperatures throughout the Midwest.

Cloud Lightning

Tropical Storm Ana forms over the Atlantic

Miami - Tropical Storm Ana has formed over the Atlantic and could strengthen as it heads toward the Leeward Islands, forecasters said Saturday.

The National Hurricane Center in Miami said Ana could trigger a tropical storm watch for parts of the Leeward Islands later Saturday. It may pick up speed and approach the islands by Monday, the hurricane center said. It was 1,010 miles east of the islands early Saturday.

Phoenix

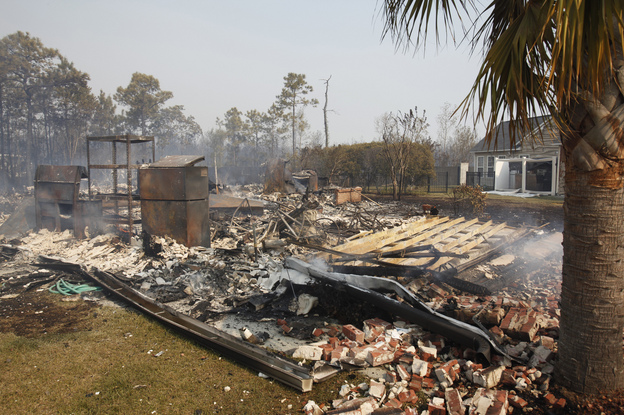
US: Wildfires force state of emergency in California county

California's Lieutenant Governor John Garamendi declared a state of emergency Friday in Santa Cruz county, where wildfires have burned for three days, prompting the evacuation of 2,000 people.

"A major fire has engulfed Santa Cruz county, and they are in great need of resources to bolster what is being done at the local level to fight these fires," he said in a statement.

"I have toured the damage and visited the operational center, and this fire is far from over," he added.

California's fire prevention agency Calfire said on its website Friday that Santa Cruz county, 560 kilometers (348 miles) northwest of Los Angeles, had ordered the evacuation of between 2,200 and 2,400 people and that more than 250 homes were threatened by the flames in the communities of Swanton and Bonny Doon.