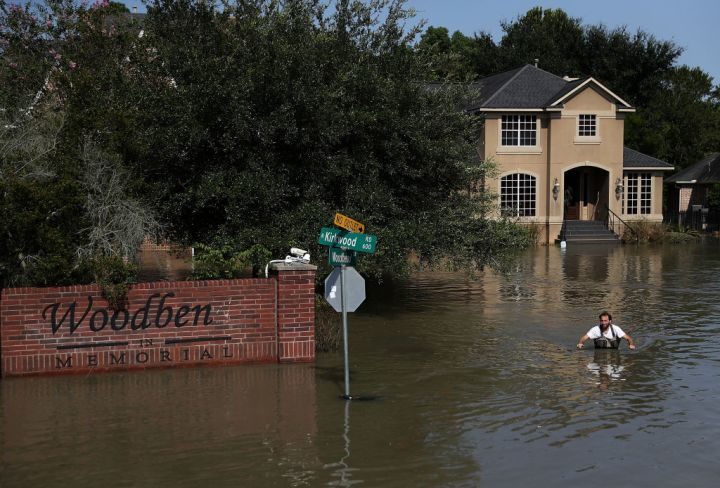
John Nielsen-Gammon, who is a Regents Professor of Atmospheric Sciences at Texas A&M and also serves as Texas State Climatologist, says Harvey set new standards for historic rainfall and flooding.
"Harvey is head and shoulders above all previous multi-day storms ever recorded in the continental United States," says Nielsen-Gammon.Nielsen-Gammon said that the most amazing record is for the five-day total over an area of 10,000 square miles.
"I examined 18 different combinations of storm lengths and area sizes, from two days long to five days long, and standard areas from 1,000 square miles to 50,000 square miles. According to the preliminary data, Harvey was the worst in all but one."
"For Harvey to average 34.72 inches over five days across that large an area is ridiculous," Nielsen-Gammon says. "The previous all-time United States record, set in Texas back in 1899, was estimated at 21.39 inches. Harvey exceeded that record by 62 percent."Ten other records were shattered by 20 percent or more, he confirms.
"To examine a storm's flooding potential, scientists and engineers look at total rainfall over a large area over an extended period of time," Nielsen-Gammon notes. "Extreme rainfall in one location causes problems, but when that rain falls over a much broader area, you get a disaster."To analyze Harvey, Nielsen-Gammon and Texas A&M colleague Brent McRoberts used the daily analyses produced by the West Gulf River Forecast Center in Fort Worth. Those detailed analyses are based on a combination of radar and rain gauge data, and are designed to help the National Weather Service with flood monitoring and prediction.
For historical context, Nielsen-Gammon compared Harvey's totals to those of major United States storms of the past, as analyzed by Applied Weather Associates, a consulting firm based in Colorado that works extensively on extreme rainfall. He supplemented those analyses with reports prepared by the Army Corps of Engineers.
Nielsen-Gammon included all of the largest storms anywhere in the lower 48 states, as well as smaller storms east of the continental divide. He included storms as recent as last year and as distant as the 19th century.
[Ed.] Attached is his spreadsheet with the numbers that Dr. Nielsen-Gammon has provided via direct email - Anthony
Harvey Rainfall Data Top5co.xlsx (Excel)
Keith Randall is an Associate Director for Marketing and Communications at Texas A&M


Reader Comments
to our Newsletter