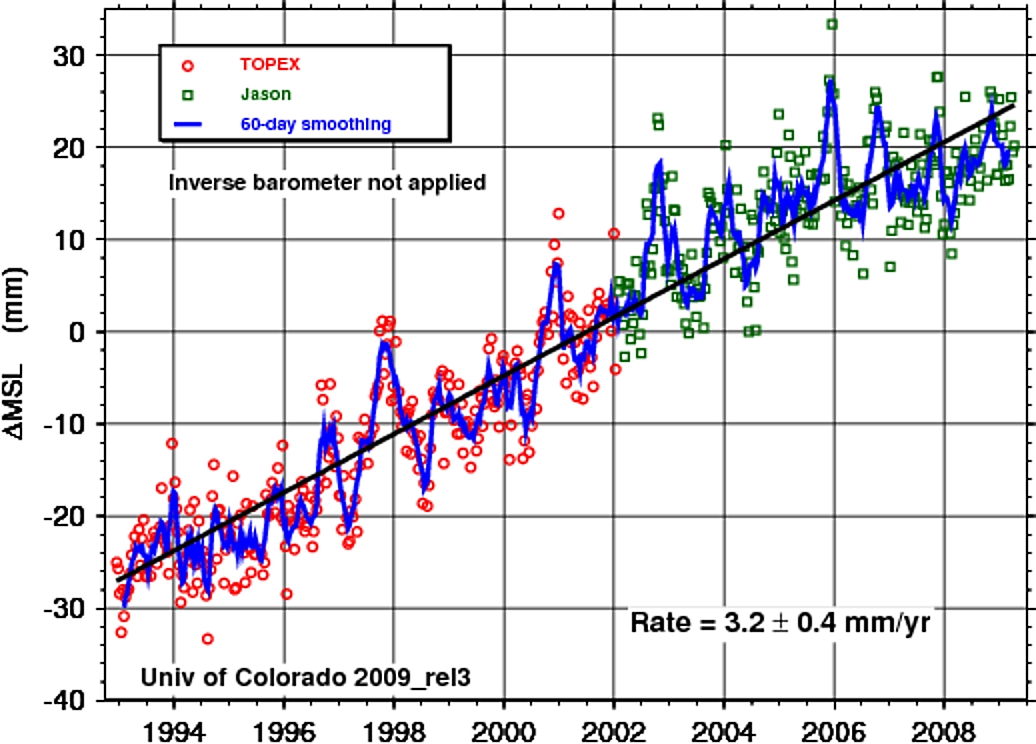
Today the University of Colorado updated their sea level graph after months of no updates. Note it says 2009_rel3 in lower left.

Here is the next oldest graph from UC that Pielke Sr. was looking at.
The newest one also looks "flat" to me since 2006, maybe even a slight downtrend since 2006. Let the wailing and gnashing begin anew.
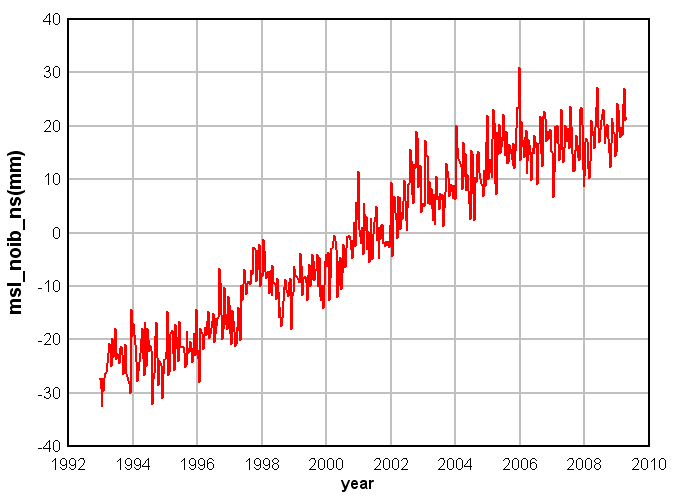
Here is the text file of sea level data for anyone that wants to plot it themselves. In fact I did myself and my graph is below, with no smoothing or trend lines.
Here's what UC says about the graph. They also provide an interactive wizard to look at specific areas.
Since August 1992 the satellite altimeters have been measuring sea level on a global basis with unprecedented accuracy. The TOPEX/POSEIDON (T/P) satellite mission provided observations of sea level change from 1992 until 2005. Jason-1, launched in late 2001 as the successor to T/P, continues this record by providing an estimate of global mean sea level every 10 days with an uncertainty of 3-4 mm. The latest mean sea level time series and maps of regional sea level change can be found on this site. Concurrent tide gauge calibrations are used to estimate altimeter drift. Sea level measurements for specific locations can be obtained from our Interactive Wizard.


Reader Comments
to our Newsletter