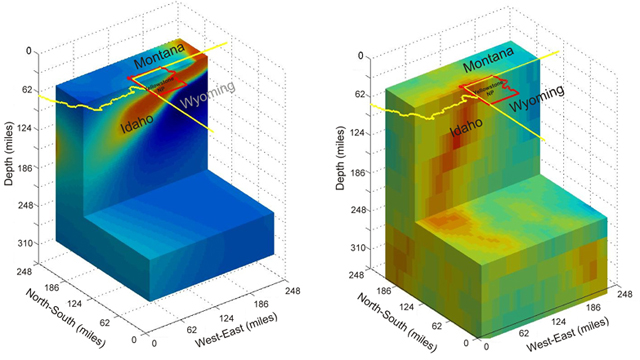
Yellowstone National Park hosts a variety of hot springs and geysers, all powered by a plume of molten rock under its surface. At times in the past, that plume has powered activity that was quite a bit less scenic: massive eruptions that have been capable of covering roughly half of North America with ash. Thus, understanding the structure and evolution of this hotspot has an immense practical value. Now, thanks to an array of sensors funded by the National Science Foundation and some new computing techniques, some researchers have produced a new image of the plume, one that suggests the area of elevated temperatures is much larger than previously suspected.

© AGUThe MT data (left) shows a larger mantle plume than that visible in seismic data.
Yellowstone sits on the same sort of mantle plume that powers the Hawaiian volcanoes. Since it's located in the middle of a continental plate, however, the behavior is quite different. Instead of relatively steady flows of molten rock, mid-continent hotspots tend to produce rare, explosive eruptions. Yellowstone's major eruptions have been separated by hundreds of thousands of years, and have packed an astonishing punch, with each eruption being thousands of times more potent than Mt. St. Helens.
Past imaging efforts have used seismic waves to detect the border between molten and solid rock. These have indicated that the mantle plume originates somewhere deep under Idaho and slopes eastward as it rises to meet the surface under Wyoming.
The new picture roughly agrees with this, but suggests the area heated by the plume may be far more extensive than indicated by the seismic data. It relies on what is termed magneto-telluric (MT) readings, which register subtle changes in the Earth's conductivity and magnetic fields. These register differences in temperature and composition of the rock and fluids, as these change alter the conductivity of the crust.
MT data was a bit hard to come by, but the National Science Foundation's Earth Scope grid has produced readings from a regularly spaced network of sensors across the western US. The authors were able to get readings from hundreds of stations across most of Idaho, Montana, and Wyoming to image the plume underneath Yellowstone.
Converting subtle differences in conductivity into a detailed map of underground structures is a rather complicated task, and a large portion of the paper is devoted to describing the computational methods that made it possible. Most of these involved adapting known solutions so that they could be run in parallel and lowering the memory requirements for the production of a single volume of the Earth's crust. Both the generation of the cells used (which were 4km on a side) and the calculations themselves were parallelized, allowing the reconstruction to be run on a computing grid in a reasonable amount of time.
The resulting picture suggests that the molten rock of the mantle plume seen in seismic images is only the core of a much larger volume of hot crust. Although this area isn't molten, the high temperatures allow water to pick up elevated levels of salt, which enables its detection through the MT monitoring equipment. The plume itself seems to slope down a bit more gently, and extend much further under Idaho than the seismic data had suggested. The MT data also confirms suggestions that the rock within the plume doesn't become molten until it reaches a depth of about 250km.
The new data provides an alternate view of the mantle plume that powers Yellowstone, one that adds to the picture painted by existing seismic data. And the techniques developed here should be applicable to other areas of the US West as more data from the Earth Scope grid becomes available.
Geophysical Research Letters, 2011. DOI:
link
There has been way too much seismic and volcanic activity going on around Earth. Yellowstone is due any day. The image of the park collapsing into the molten sea below, igniting a burst of energy unknown to all, is a geological wonder and nightmare.
"Three times in the past 2 million years, large reservoirs of rhyolite magma have accumulated in the upper crust at Yellowstone, triggering cataclysmic eruptions and caldera collapses 2.0, 1.3, and 0.6 million years ago." [Link]
Rhyolite Magma then, is the key factor.
"Magma also contains gases, which expand as the magma rises. Magma that is high in silica resists flowing, so expanding gases are trapped in it. Pressure builds up until the gases blast out in a violent, dangerous explosion. Magma that is relatively poor in silica flows easily, so gas bubbles move up through it and escape fairly gently." www.wikipedia.org
It would come as no surprise with everything else erupting all over the world. The morning I awoke and saw the Tsunami hitting Japan was a feeling I had not felt before. The morning I saw the World Trade Center being attacked was a sinking feeling beyond all that I had known. The morning I awake after feeling an unfamiliar rumbling in the earth is going to displace all terrors especially when I pull up the Internet News and see the headline that Yellowstone has had a major eruption. The Satellite images will be the most frightening as we watch the ash fill the skies and cover the North American Continent...then the world. Consumers will literally be cast into the Lake Of Fire.