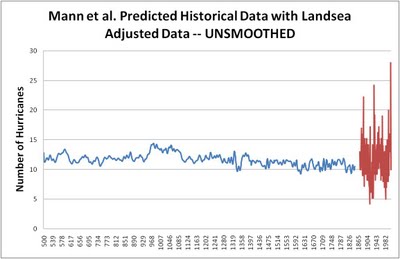
I was curious how the curve shown in Mann et al. discussed earlier today would look using adjusted data, and thanks to Michael Mann the data is up online allowing a comparison with data adjusted according to work in 2007 by Landsea (i.e., it doesn't include the analysis from Landsea et al. released this week).
I graphed (above) the adjusted data (red curve) along with Mann et al.'s "predicted" historical data (blue curve, based on the Landsea data) both unsmoothed, just to see what it looks like -- using information from these files at Mann's directory:
Statistical Model Predictions of TC Past ActivityI now see why Mann claims that the Landsea adjustment does not matter. And he is right, it does not matter.
Alternative Case (uses Landsea '07 adjustment of historical TC series) (AD 500-1850)
http://holocene.meteo.psu.edu/~mann/Nature09/TCStatModelReconLandsea.dat
Historical Tropical Cyclone (TC) counts
Alternative case [Landsea '07 adjustments](1870-2006)
http://holocene.meteo.psu.edu/~mann/Nature09/TCLandsea.dat
The Mann et al. historical predictions range from a minimum of 9 to a maximum of 14 storms in any given year (rounding to nearest integer), with an average of 11.6 storms and a standard deviation of 1.0 storms (!). The Landsea observational record has a minimum of 4 storms and a maximum of 28 with and average of 11. 7 and a standard deviation of 3.75. I suspected that a random number generator for hurricane counts since 1870 would result in the same bottom-line results and when I appended a series of random numbers constrained between 9 and 14 from 1870-2006 to the "predicted" values, lo and behold --- 20th century values exceed every other point except about 1,000 years ago.
Mann et al.'s bottom-line results say nothing about climate or hurricanes, but what happens when you connect two time series with dramatically different statistical properties. If Michael Mann did not exist, the skeptics would have to invent him.


Reader Comments
to our Newsletter