Magnetic anomalies are caused by differences in the magnetisation of the rocks in the Earth's crust.
Many years of negotiation were required to obtain confidential data from governments and institutes.
Scientists hope to use the map to learn more about the geological composition of our planet.
The World Digital Magnetic Anomaly Map (WDMAM) is available through the Commission for the Geological Map of the World.
|
| ©BBC |
The magnetic signature of the Earth's crust has been measured for many decades by a multitude of groups; but now, for the first time, the data has been combined to give a truly worldwide view of the phenomenon.
A British company involved in the project is GETECH, a spin-off from Leeds University.
Valuable tool
Managing Director Dr J Derek Fairhead explains: "The project is the result of a lot of coordinating efforts by the IAGA (International Association of Geomagnetism and Aeronomy) organisation to put together a magnetic map of the world, and it's taken decades to get to this position.
"Many of the companies and country organisations who hold the data in a confidential mode have been prepared to release 'decimated versions' of their data so that the commerciality of the data isn't affected.
"But the regional nature of the magnetic field can be clearly imaged and put together with all the other data to generate a global image of the magnetics."
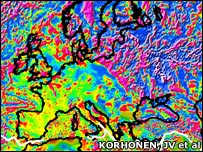
Dr Juha Korhonen, one of the lead researchers on the project from the Geological Survey of Finland, explained that the map was available at "a low resolution".
"It represents a square grid of about five kilometres, so it's very coarse indeed. It is a starting point, and to go into detail, you can contact those organisations who have more detailed data on both the geology and mineral sources.
"There are just a few major deposits that can be seen on this map, like the Kursk iron ore deposit. Mainly one can see the major geological formations.
"It's generally considered in prospecting and resource analysis that this magnetic anomaly field is one of the most valuable tools or regional assets."
Many causes
The global map shows the variation in strength of the magnetic field after the Earth's dipole field has been removed (Earth's dipole field varies from 35,000 nanoTesla (nT) at the Equator to 70,000 nT at the poles). After removal of the dipole field, the remaining variations in the field (few hundreds of nT) are due to changes in the magnetic properties of the crustal rocks.
Hot colours (reds) indicate high values; cold colours (blues) indicate low or negative values.
As well as revealing ore deposits, magnetic anomalies can also show areas of ground water and sea weakness zones. It is a useful tool for geologists and geophysics, as well as a teaching resource.
The information can be viewed as a flat, two-dimensional map or rendered in 3D on a virtual globe.
There are several different causes of magnetic anomalies in the Earth's crust.
On the ocean sea bed, the map shows a striped effect. Where Earth's tectonic plates are moving apart, new crust is created at mid-ocean ridges.
As the new material spreads out and cools, minerals in the rocks that make up the crust are magnetised in the direction of the Earth's magnetic field at the time of their formation. This field reverses polarity over time, creating alternating stripes on either side of the ridge.
On land, the dominant factors for magnetic anomalies are the thickness of the magnetised layer and the composition of the crust. Usually, young crust is relatively thin and has a low content in magnetic minerals.
The old cratons, stable interior sections of the continental crust, are thicker and have high magnetic mineral content. Perhaps the most prominent feature is the Kursk anomaly, which can be seen at the border between young western Europe and the old "Baltic Shield".
First identified in the late 18th Century, the anomalous region became the focus of a major industrial effort by the Soviets to develop iron ore mines.
Pieces in a jigsaw
The international team had many difficulties to overcome in creating its map.
Dr Korhonen said: "To acquire the Russian data required a ministry decision there. Then India released their data. We have Argentine data, similarly, which has been closed to all the world."
Dr Michael Purucker from the US space agency (Nasa), a user of the map, said: "There are literally hundreds, perhaps thousands, of organisations around the world which hold this kind of data. One should not underestimate the diplomatic efforts needed to secure support and data contributions from these organisations."
One of the challenges in gathering data from many different sources is piecing it together, and ensuring that all the data sets are in the same format.
"There are different techniques," explained Dr Korhonen. "If the techniques are somewhat similar, it's fairly easy finally doing the calculations in a similar fashion to put the map together.
"If the anomaly is defined in some other way, then we might have [a] problem. That's the main reason that the long wavelengths have been removed from the ground-based data and replaced by satellite data."
Next steps
This magnetic data has been gathered by Champ, a German and Russian-built satellite that has been in orbit since 2001. Now coming to the end of its life, it has charted the entire globe.
Not only does Champ measure the Earth's magnetic field, it can also measure the very long wavelength components of the Earth's crustal field with wavelengths greater than about 400 km, said Dr Fairhead.
With the publication of the first edition of the map, the team is already planning the second edition.
One area it hopes to improve on is the marine data coverage. The first edition uses information from the US National Geophysical Data Center, but there are other sources that may help to improve the accuracy of the map.
The upcoming Swarm magnetic field satellites, to be flown by the European Space Agency (Esa), will also help build new detail into the map.


This map of gravitational/magnetic anomalies is very important, in my opinion.
Considering that various "supernatural" events may be intrinsically connected to the areas where they take place.
I just had a quick glance at the Wiltshire area in UK - an lo and behold - this is where WDMAM shows a big increase in the magnetic values.
In fact, when you overlay the data on a Google Earth display, you can quickly see that the entire area between Wiltshire and London ought to be "exciting".
France has interesting features as well...