Extreme Temperatures
But it gets crazier.
Add in another 37 to 43 inches of snow Thursday night, and additional amounts ranging from 21 to 35 inches every 12 hours through Saturday night, plus a light dusting of 11 to 17 inches on Sunday... ...and you get a storm total of 176 inches. On the low end. Add up the high end of the numbers and you get a forecast maximum of 218 inches of snow in four days!
The roads in the capital were clogged up and about 70 flights from Moscow's largest Domodedovo airport were disrupter overnight. On Thursday, all three of the capital's airports are working normally.
Officials in the Russian capital have called in 12,000 snow-removal vehicles to help combat the effects of the snow on the city's transport system but, in spite of lengthy efforts to minimise disruption, traffic jams have been reported to stretch back several kilometres on Moscow's roads.
"I was speaking with the forecasters, and it's been more than 50 years since Moscow's seen something like this," said Deputy Mayor Pyotr Biryukov on a television interview.
Further to gridlock in the city, flights from Moscow's airports have also faced major delays overnight. The capital's largest airport, Domodedovo, experienced over 70 flight delays, but was back to regular service by 5 a.m.

A pedestrian walks down the sidewalk as a man clears the way in downtown Saskatoon, Sask. as a heavy snow falls Tuesday, March, 6, 2012. The Weather Network's top forecaster is advising Canadians to keep their winter mitts close and snow shovels even closer as he expects much of the country is in for a harsher blast of winter than it was dealt last year.
"We'll get more winter this year than we did last year," said director of meteorology Chris Scott.
And that means a return to more "typical" historic conditions of cold and snow gripping much of the country, he said.
"If you think back on Christmas Day (2011) there were many major cities in the country that didn't have a lot of snow on the ground - and that was the theme for the winter."
"The way things are shaping up right now we think there'll be more cold air to work with and as a result we think that some of these storm systems that track through will dump a bit more snow than they did last year," Scott said.

European cave bear: It is thought Neanderthals revered the animal and treated it as a god
Professor Anthony Stuart, a Natural History Museum palaeontologist, and a colleague from the University of Vienna, used new radiocarbon dating of fossil remains from sites across Europe, to accurately establish the timing of the bear's disappearance.
The cave bear (Ursus spelaeus) was found across much of Europe from Spain to the Urals but no further east suggesting it was unsuited to areas of extreme temperatures.
Despite weighing up to 1,000lbs the cave bear, unlike its modern day counterpart which eats fish, was entirely vegetarian and probably ran out of food as the climate cooled and vegetation disappeared.
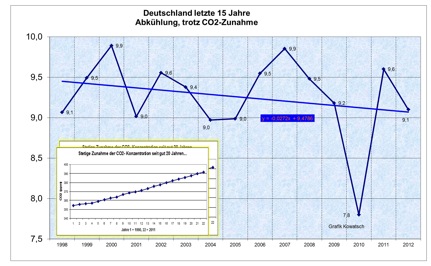
Page's prediction is based on observation of the geologic record. He notes that there has been no net warming since 1997 even thought carbon dioxide content of the atmosphere has risen 8.5%. Page says that atmospheric temperature is driven by sea surface temperature (SST) which is, itself, solar driven. The oceanic oscillations control the general climate.
There is good correlation between solar cycles and SST, but note that because of the enthalpy and thermal inertia of the oceans, there is a 10 - 12 year lag between solar cycle troughs and global SSTs. This lag time definitely establishes cause and effect similar to the lag in carbon dioxide changes following temperature changes in the major glacial cycles as shown in ice cores The graph below shows the variations in the Pacific Decadal Oscillation (PDO), the major oceanic oscillation (the red line is actual measurement, the blue line is predictive modeling.) (Graph source here.)
Page says than in the figure "an approximate 60 year cycle is obvious by inspection and this coincides well with the 30 year +/- positive (warm) and 30year +/- negative (cold) phases of the Pacific Decadal Oscillation." The graph "shows warming from about 1910 to 1940-45, cooling from then to about 1975, warming to about 2003-5 and cooling since then. Total warming during the 20th century was about 0.8 degrees C." He also says that it is clear that we are entering the beginning of a 30-year cool phase of the PDO.
Introduction.
Over the last 10 years or so as new data have accumulated the general trend and likely future course of climate change has become reasonably clear. The earth is entering a cooling phase which is likely to last about 30 years and possibly longer. The major natural factors controlling climate change have also become obvious.Unfortunately the general public has been bombarded by the scientific and media and political establishments with anthropogenic global warming - anti CO2 propaganda based on the misuse and misrepresentation of already shoddy IPCC "science" for political ,commercial and personal ends.
The IPCC climate science community largely abandoned empirical Baconian inductive scientific principles and built worthless climate models based on unfounded assumptions designed to show that anthropogenic CO2 was the driving force behind changing climate. Most of the IPCC output is useless as a tool for predicting future climate trends and their impacts and in particular the IPCC Summaries for Policymakers can be safely ignored for practical purposes. The divergence between the IPCC Hansen projections and the observed trends is shown [below].
Fortunately, however , the basic data is now easily available so that any reasonably intelligent person can check on line daily or monthly to see what the incoming empirical data actually is and draw ones own conclusions.
Here's how to do it in a few simple steps. I have put in CAPITALS the main empirical observations on which one can draw conclusions re climate change, its causes and future trends and also get a good idea of weather patterns and trends for the next year or so.

Rutgers University Climate Lab : Global Snow Lab.
http://climate.rutgers.edu/snowcover/table_area.php?ui_set=0&ui_sort=1
Climate experts tell us that declining snow and ice cover is an essential ingredient of global warming.
Temperatures will fall as low as minus 20C in rural areas, forecasters warned last night, while heavy snow and "potentially dangerous" blizzards will close roads and cripple rail networks.
James Madden, forecaster for Exacta Weather, said: "We are looking at some of the coldest and snowiest conditions in at least 100 years. This is most likely to occur in the December to January period with the potential for widespread major snowfall across the country.
"Parts of the North, Scotland and eastern England are likely to experience a run of well below average temperatures, which will include some potentially dangerous blizzard conditions at times."
He warned the South faces a bout of "unusually heavy snowfall" in December.
Leon Brown, meteorologist for The Weather Channel, said snow could arrive as early as next weekend, with temperatures falling to minus 5C in the North.
"There is a 30 per cent risk of some snow over lower levels in Scotland on Friday."

Maintenance crews work to remove snow from Nelson Stadium Friday for Carroll College's final game of the season Saturday against Dickerson State. In the last 48 hours the Helena area has received about 12 inches of snow, which made for intense work to clear the stands and field.
Helena saw 8.8 inches of snow Thursday. The previous snowfall record for Nov. 8 was 2.3 inches, set in 1903.
Zach Uttech, a meteorologist with the National Weather Service in Great Falls, said the south-west flowing air mass from Canada has created an ideal scenario for widespread snow over the region, blanketing Montana with an abundance of snow.
Total snow accumulation could hit nearly 14 inches in downtown Helena, which would put Thursday and Friday among the top for highest snowfall in a two-day period for the month of November, Uttech said. As of noon on Friday, the two-day total was 12.6 inches.