© GONG
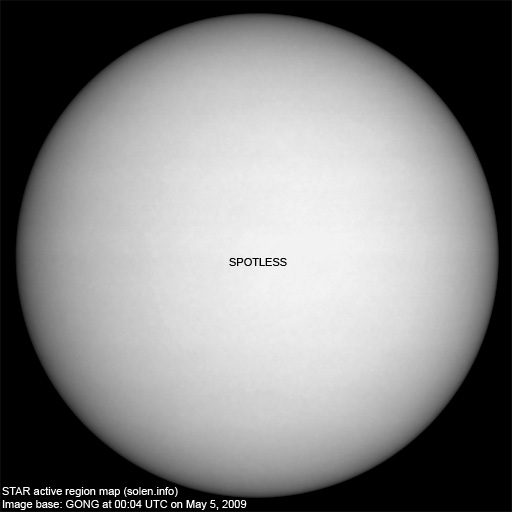
A prolonged lull in solar activity has astrophysicists glued to their telescopes waiting to see what the sun will do next - and how Earth's climate might respond.
The sun is the least active it's been in decades and the dimmest in a hundred years. The lull is causing some scientists to recall the Little Ice Age, an unusual cold spell in Europe and North America, which lasted from about 1300 to 1850.
The coldest period of the Little Ice Age, between 1645 and 1715, has been linked to a deep dip in solar storms known as the Maunder Minimum.
During that time, access to Greenland was largely cut off by ice, and canals in Holland routinely froze solid. Glaciers in the Alps engulfed whole villages, and sea ice increased so much that no open water flowed around Iceland in the year 1695.
But researchers are on guard against their concerns about a new cold snap being misinterpreted.
"[Global warming] skeptics tend to leap forward," said Mike Lockwood, a solar terrestrial physicist at the University of Southampton in the U.K. (Get the facts about global warming.) He and other researchers are therefore engaged in what they call "preemptive denial" of a solar minimum leading to global cooling.

